|
I finally got around to putting out a new blog post, I must say I struggled to come up with just the right topic that would both interest me and our readers. I wanted to do a financial planning related post, but over the weekend I changed my mind. I was drawn to a video debate between Macro specialist Raoul Pal of Real Vision and Peter Schiff of Euro Pacific Asset Management.
This rather long video is posted, below. I thought the discussion was so important for investors over the next 6+ years that I would make it part of my discussion and forecast on what is coming in this very strange time in our country and economic future. In case you don't have 3 hours to spend watching this video, let me give you the highlights. The primary topic of this discussion was Bitcoin and its role in the current economic landscape. Let’s delve into some key points from their debate:
So now let me put in my 2 cents. First, I am in agreement with both Raoul Pal and Peter Schiff that politicians will continue to print currency and tax us as a way of kicking the can down the road on the United States rapidly growing debt problem and poor demographics. They will always do what is easy and gets them reelected. Printing, spending and then taxing us is the easy path vs. austerity measures to fix our debt to GDP imbalance. Second, I believe Bitcoin and Crypto are part of the solution, but not "the solution." Why? a) Bitcoin is correlated to the equity markets and is a very volatile asset type. Pushing all your chips into this pile will definitely cause you some sleepless nights. b) There is governmental risk here. Any day we could wake up and the government has either outlawed crypto or mandated a conversion to a newly issued Central Bank Digital Coin (or CBDC); and finally, c) I still believe diversification has value and crypto is not a very large, or liquid market. Third, I would make the case that 2030 is an important year in Raoul Pal's mind, even if he never explained why. Allow me to speculate, it is the year that the World Economic Forums (WEF) 2030 Agenda is supposed to be in place. This could mean a new economic system is in place by 2030 that changes/saves the developed world from a new universal problem with debt relative to GDP and poor demographics. In case you are not familiar with the WEF 2030 agenda, here are the highlights:
You can click on any of the links for more information. Here are my thoughts on this WEF 2030 Agenda. Basically, the WEF is composed a who's who of global leaders that think they know better than us or any individual government what is best for us and them. It is the "them" part that worries me the most. The above agenda sounds great in a vacuum, but the primary purpose of this agenda is the separate the elite from the serf (i.e., you and me) and make us subservient to the corporate elite. The result will be a highly advanced, AI based society where every move you make, financially or otherwise, is scrutinized. Every word or deed out of line with the thoughts of the elite will be penalized (i.e., social credit scoring). My belief is that by 2030 a CBDC or series of CBDCs will be rolled out globally. These CBDCs may not be universally utilized, as is now the case in China, but the infrastructure will be there. Given that the backbone of the CBDCs will be blockchain based all activity will be captured, stored and reviewed using AI. The only thing missing will be an event, a crisis pushing everyone into CBDC or the global system. This I believe is the change that Raoul Pal sees in our future but was unwilling to speculate on it as I have done. So why do I present this video, agenda and hypothesis to you? The answer is simple and that is so you can take advantage of what is available today to create wealth and provide yourself a greater runway to operate in a possible new financial system to come. Further as a Christian believer, it is a bit of a warning as the Christian Bible talks about such a time where there is both a one world currency and a one world leader. No one knows the timing on this stuff, but I can certainly see the seeds of what is potentially coming. So now how do you prosper in the next six plus years to come? Here is my take:
Where can we help? We can help you with all of the above as well as financial planning. Want to start a conversation, click here to contact us.
0 Comments
In our last post entitled "Why Understanding Up and Down Capture is Important to You?" we talked about both up and down capture and how they fit with secular periods of market consolidation. We also discussed that the ideal manager has both a lower down capture and a high up capture ratio. As an example, a 60% down capture means that you only lost 60% of what the benchmark loses in periods where it declines on average. Further, we noted that InTrust’s historical up capture is about 86% on average for our active investment strategies. Our down capture is about 56% in round numbers for the same active strategies.1 The real secret to such metrics is when markets are volatile, like we had in the last secular bear market that lasted from 1966 to 1982 or 2000 to 2009. In my opinion, we are now in a secular bear market, and I believe it will be a brute, like the one that spanned the 1970s. It will not be identical to the 1970s as no two periods are alike, but it will have a number of similarities. The reason secular bear market and cyclical cycles are important is that differing investment strategies perform differently during such cycles. Passive or buy and hold performs best in secular bull cycles. This is because they do not practice risk management other than via diversification, they are low cost and do not make significate changes to the portfolio holdings or exposures. In other words, they are very lean and efficient. Active strategies perform best in secular bear cycles. This is because they do practice risk management including diversification but also changes to exposure, positions and more. What is a drag on performance in the secular bull period helps enhance and protect returns in a secular bear market. We mix active and passive strategies because we never really know what markets will do but we obviously can make educated guesses or assumptions. Let’s take a look at an example of what happens to return in a secular bear market cycle when proper risk management is applied, and market exposure is adjusted for the market environment. In other words, the manager captures only a reasonable percentage of up market returns and/or a low-down market capture ratio. In this case, I applied our average up and down capture to benchmark returns for the period 2000 - 2010 where Actively Managed Large Blend strategies outperformed. This is not a perfect comparison, but a majority of our active strategies use this index (i.e., the Dow Jones Industrial Average) as at least part of the blended benchmark index. So, what did we discover? 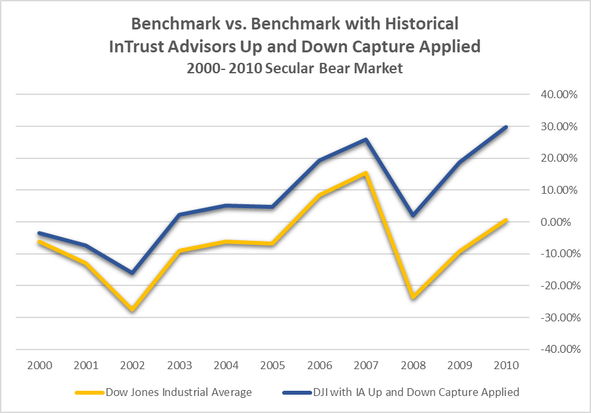 The average performance increase was 2.7% per annum over just buying and holding the index over this period. Again, we may have captured less up market performance, but we avoided more of the down-market under-performance and in this period, there was a great deal of market volatility. Let’s go back a bit further, let’s say we have a repeat of the 1966 – 1982 secular bear market that included the volatile 1970s. What does that look like? 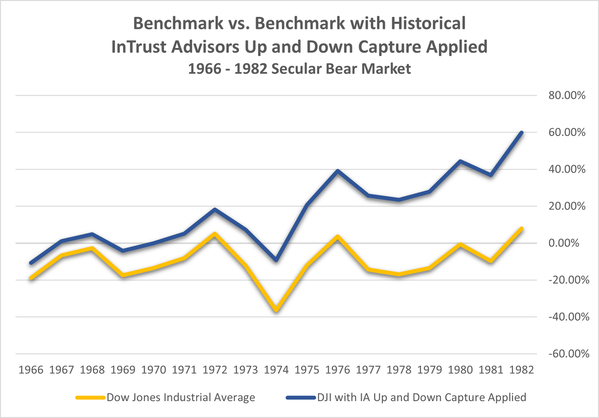 Even during this volatile period, applying InTrust’s historical up and down capture rations resulted in an average 3.1% per annum performance pick up for this period over just buying and holding the index.
Now these are all proforma or hypothetical results, but I do believe we can draw a few conclusions. First, there are definitely periods for markets where just buying and holding (i.e., passive management) will underperform. See Hartford’s chart of Active and Passive Outperformance Trends in the post, Understanding Up and Down Capture of Returns. Second, from a probability perspective, we are likely due for one of those periods based on Hartford’s chart of Active and Passive Outperformance Trends. Finally, you need to be prepared for such periods. Most American’s suffer from recency bias and overweight what has been working to the detriment of what has not been working as well. This bias can really hurt investors when Mr. Market flips the switch and decides to benefit the active managers by making markets more challenging for everyone. My guess, my friends, is that we started such a period at the beginning of 2022. Let us know how we can help you be ready for Mr. Market flip of the switch. Disclosures/Footnotes 1 Excludes our modified buy and hold or passive strategies. This statistical is based on historical data from inception through July 2023 for each active strategy. The Dow Jones Industrial Average is a price-weighted average of 30 significant stocks traded on the New York Stock Exchange and the Nasdaq. The DJI was invented by Charles Dow back in 1896. The up-market capture ratio is the statistical measure of an investment manager's overall performance in up-markets. It is used to evaluate how well an investment manager performed relative to an index during periods when that index has risen. The up-market capture ratio can be compared with the down-market capture ratio. In practice, both measures are used in tandem. The down-market capture ratio is a statistical measure of an investment manager's overall performance in down-markets. It is used to evaluate how well an investment manager performed relative to an index during periods when that index has dropped. The ratio is calculated by dividing the manager's returns by the returns of the index during the down-market and multiplying that factor by 100. The famous saying goes “it is not what you make, but what you keep.” This is true of investment returns after the tax man takes his piece. It is also true about how much of the up market returns you keep as well as how much of the down market returns you avoid. This, of course, can be measured and most of the best investment managers do indeed provide such metrics. Here at InTrust Advisors, we track those metrics as well. The first is up capture or the amount of the upward move of the markets we capture vs. our blended benchmarks. The second is down capture or the amount of the downward move of the markets we capture.  Ideally, the up capture is a high percentage with 100% being the top capture possible without the use of leverage. Also, ideally the down capture is low. As an example, a 60% down capture means that you only lost 60% of what the benchmark loses in periods where it declines on average. InTrust’s up capture is about 86% on average for our active investment strategies. Our down capture is about 56% in round numbers for the same active strategies.1 As you might expect, we spend a lot of time trying to figure out how to raise up capture or lower down capture statistics. We are quite proud of the down capture. We believe it allows our clients to sleep like babies, realizing we took almost half of the market’s volatility out of the equation (on average). Now this is all well and good, but let’s be honest when markets are juiced like they have been the past ten years and they just go straight up, who cares about up capture or down capture? The real secret to such metrics is when markets are volatile, like we had in the last secular bear market that lasted from 1966 to 1982. For those not in the know, a secular bear market is a long-term period where markets generally move up and down in a large consolidating range. The chart below shows the market to be in a long bear cycle (in red), currently. However, I don’t know if I agree with that assessment. I believe we may have had a secular bear market from 2000 to 2009, which was then followed by a secular bull market from 2010 to 2021. In my opinion, we are now at the start of another secular bear market, and I believe it will be a brute, like the one that spanned the 1970s. 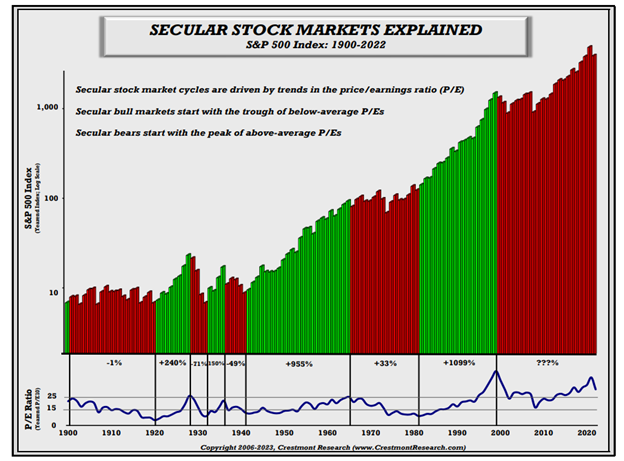 Just so we are clear, In the above diagram, the periods in red are secular bear markets and the periods in green are secular bull markets. It’s during these secular bear markets that maximizing up moves or capture and minimizing down moves or capture becomes important. Not to get carried away with cycles, but within each secular cycle are smaller cyclical bull and bear markets as shown below for the 1966 - 1982 period. You can link on the link to get more information on secular vs. cyclical cycles. 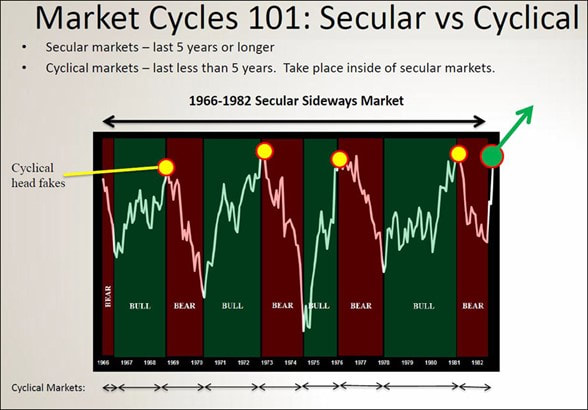 The reason secular cycles are important is that differing investment strategies perform differently during such differing secular cycles. Passive or buy and hold performs best in secular bull cycles. Active strategies perform best in secular bear cycles. We mix active and passive strategies because we never really know what markets will do but we obviously can make educated guesses or assumptions and adjust allocations tactically for the perceived secular cycle (i.e., bull or bear). You can see this graphically below in the Active and Passive Outperformance Trends chart where you can see that Passively Managed Large Blend strategies have handily beat Actively Managed Large Blend strategies since 2011. However, you can also see there was the start of what appears to be a possible reversion to the mean in 2022. You can also see where Actively Managed Large Blend strategies decisively outperformed Passively Managed Large Blend strategies in the 2000 – 2010 period. 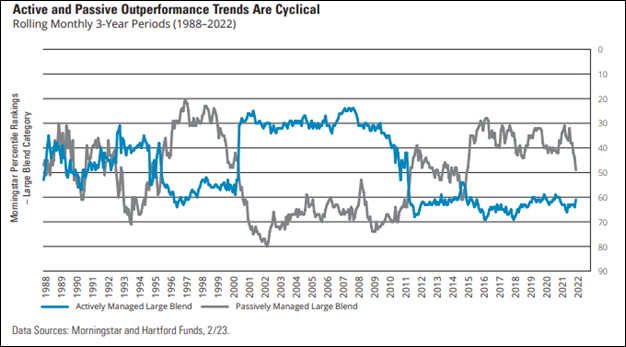 It appears to us that we are transitioning to another period where active strategies may outperform passive strategies. When economic environments tend to get tougher, active strategies to do a better job of managing risk.
We will delve into why a lower down capture can help your portfolio in those periods where active strategies outperform in our next post. Disclosures/Footnotes 1 Excludes our modified buy and hold or passive strategies. This statistical is based on historical data from inception through July 2023 for each active strategy. The up-market capture ratio is the statistical measure of an investment manager's overall performance in up-markets. It is used to evaluate how well an investment manager performed relative to an index during periods when that index has risen. The up-market capture ratio can be compared with the down-market capture ratio. In practice, both measures are used in tandem. The down-market capture ratio is a statistical measure of an investment manager's overall performance in down-markets. It is used to evaluate how well an investment manager performed relative to an index during periods when that index has dropped. The ratio is calculated by dividing the manager's returns by the returns of the index during the down-market and multiplying that factor by 100.  The end of the year is fast approaching and it's a great time to take steps that can help improve your personal finances. Here are some items to consider:
Taking the time to address these items now can help make next year a great financial success. Contact us if we can help you analyze your situation or achieve your investment goals. This is a very complex Macro environment due to Federal Reserve interventions, Government stimulus programs and fuzzy economic numbers that reflect the will of the party in power in Washington. Quite frankly, the last ten months for me have been very challenging. It was only recently that I stood back and tried to take a much longer, big picture view of the Macro landscape here in the U.S. that I think will frame how we tactically manage money for the next decade or more here at InTrust Advisors. What is that framework? Here it is: No. 1. The U.S. Government cannot repay its debt and lacks the will to do so. No. 2. The elected leaders in Washington will continue to print money, grow the size of the national government, and raise the U.S. debt levels because the alternatives (balanced budgets, debt repayment, downsized government, etc.) are just not something they want to stain their term in office and ability to seek reelection!  No. 3. Due to weak wills and misplaced objectives, the U.S. will have no choice but to inflate away its debts. It will not risk default, nor will it move away from the path of bigger government and more for all. No. 4. Traditionally foreigners have been big U.S. Treasury buyers. No longer, they are headed down the same path or they are seeking to separate themselves from the dollarized world and they will not be big treasury buyers going forward as you can see in the chart below. 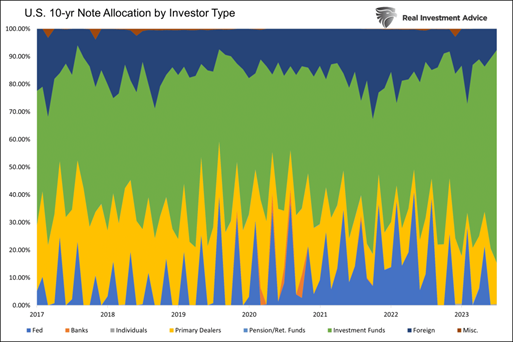 No. 5. The U.S. Government cannot allow interest rates to continue upward. The interest carry will continue to compound and become just too big a part of the U.S. budget. No. 6. The Federal Reserve will be the only big buyer of treasuries and that means currency debasement to do so (i.e., a falling dollar). This debasement may be hidden by a race for the bottom with other countries and currencies, but I think this is a race we will win! No. 7. The U.S. will use financial repression to debase its currency in a controlled fashion. However, it could spiral out of control and lead to runaway inflation. Financial repression is a term that describes measures by which governments channel funds from the private sector to themselves as a form of debt reduction. Financial repression here could be paying a return on treasuries that is less than zero after adjusting for inflation whereby they slowly rob citizens of purchasing power to lower debt levels in nominal terms. No. 8. U.S. residents could become U.S. treasury buyers in retirement plans or pensions. This will be sold to us as a way of protecting retirement savings but really would be about finding a home for this ever-increasing pile of debt. Japan’s citizens do this willingly. It’s likely here in the U.S. this will be legislated upon us. No. 9. Treasuries will no longer be a store of long-term value. They will need to be more actively managed and over time will lose some of their luster as rates are held down while inflation rises (i.e., financial repression). Also 40 years of falling interest rates has led to a fixed income being a larger part of every portfolio, rising rates over the next few decades will do just the opposite. 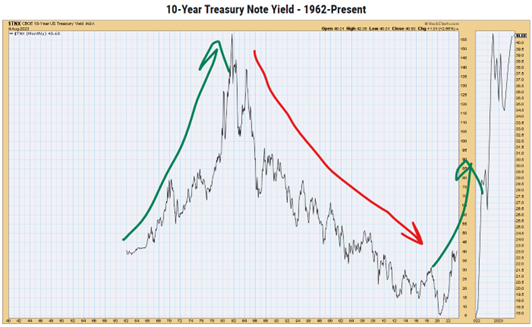 No. 10. Gold, commodities, and hard assets will once again become important holdings for Americans. The diversification of holdings into more than just stocks and bonds will become increasingly important. In summary, we are on the verge of a shift in our country’s financial outlook like we have not experienced in many years. The last such period was probably the late 1960s and 1970s. This may seem like gloom and doom but for every challenge there are opportunities as well! Let us know if we can help you unlock those opportunities. Disclaimer: This material has been prepared for informational purposes only, and is not intended to provide, and should not be relied on for, tax, legal or accounting advice. You should consult your own tax, legal and accounting advisers before engaging in any transaction. |