|
Over the past month, stock markets around the world have been rallying on two things. The first is the assumption that the U.S. Federal Reserve will stop and/or even reverse their interest rate policy that has take rates from near zero towards 5%. The second is the reopening of China post Covid in that country. The million-dollar question is the market right (new Green Shoots) or will this end badly for market participants (a Mirage)?  You may recall the market has had Bear Market rallies leading up to the last several Federal Reserve Open Market Committee meetings just be to smacked down by the Fed and markets thereafter. No manager really knows for sure. We suspect that the Federal Reserve will have some rather hawkish commentary for the markets, but we could be wrong. Only the Fed knows for sure at this point. What is interesting to see is how the markets push the envelop trying to anticipate the next moves for interest rates and the economy. They are essentially front running the Fed as you can see in the chart below: 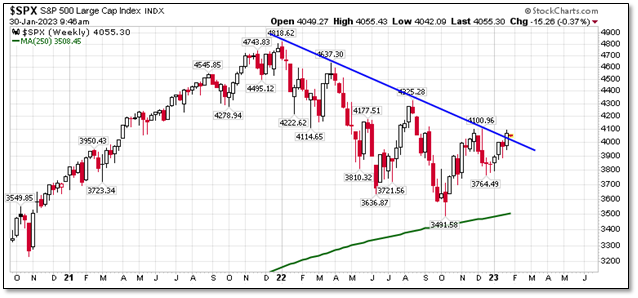 Markets have rallied all the way up and slightly beyond the long-term trend line (blue line) for this Bear Market to date. It is amazing the timing that this all happens right into the week of the Fed’s Open Market Committee meetings which are Tuesday and Wednesday of this week. Traditionally, I think the market knows ahead of the Fed and it would be smart to follow the markets. However, this time around, the markets by rising have essentially eased liquidity, this drives the wealth effect, which then drives spending and finally that drives inflation. You can see how financial conditions have eased below with both the Chicago Fed National Financial Conditions Index and Chicago Fed Adjusted National Financial Conditions Indexes in red and blue declining relative to the white Fed Funds rate. If you are the Fed, that is the last thing you want when you are trying to fight inflation! 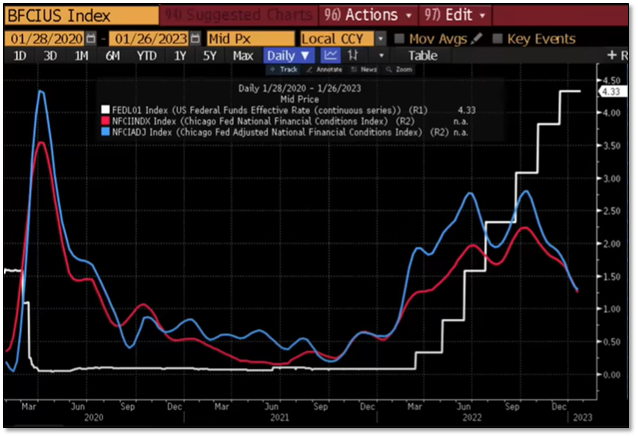 Also, the reopening of China following Covid will put additional upward pressure on commodity prices, which is inflationary. Again, this is exactly what the Fed does not want.
How will the Fed respond? We believe they will be extremely Hawkish and tell the markets that they have much further to go with either Fed Fund rate increases and/or that there will be a lengthy pause when they do stop raising Fed Fund rates to see how past Fed Fund rate increases will affect the economy and inflation. They will definitely dispel the notion that they will be reversing Fed Fund rates as the market is now forecasting. This will not be music to the market’s ears! The result will be a long-overdue pullback or even the resumption of the Bear Market decline. As we have told clients in one-on-one annual reviews, we expect a lot of fits and stops for the markets in 2023. Inflation followed by disinflation and then deflation and then back to inflation. It is going to be a fluid market environment! Again, we could be wrong and if that is case, we will course correct! Maybe we get a pullback that leads to a breakout and higher markets. That would be fine with us as long as we get that pullback! So much of this market is about waiting, watching, and then reacting at the right time. It takes patience, nerves of steel and it will very tough to get completely right! We will see if that patience pays off this time! At InTrust Advisors, we pair actively managed and passively managed investments in client portfolios to lower volatility and hopefully enhance long-term returns. If this is something you are looking for, please feel free to reach out to us for a free consultation. Disclosures Past performance is not an indication of future performance and there can be no assurance that the strategy will achieve results in line with those presented in this performance summary. This document is for informational purposes only and is not intended as an offer or solicitation with respect to the purchase or sale of any security. The S&P 500 is a capitalization weighted index of the 500 leading companies from leading industries of the U.S. economy. It represents a broad cross-section of the U.S. equity market, including stocks traded on the NYSE, Amex, and Nasdaq. The Chicago Fed’s National Financial Conditions Index (NFCI) provides a comprehensive weekly update on U.S. financial conditions in money markets, debt and equity markets, and the traditional and “shadow” banking systems. Because U.S. economic and financial conditions tend to be highly correlated, they also present an alternative index, the adjusted NFCI (ANFCI).
0 Comments
It’s that time again. Time for the New Year’s Resolutions. Certainly 2023 has to be better than 2022, right?  I am sure most of you have not thought twice about a financial or investment related resolution. In fact, I would guess a majority of you have been afraid to open your brokerage statements or look up your account balances online. That is perfectly normal behavior! However, this time around, I want to encourage you to think about an investment related resolution. What is the resolution? To move some, not all, your investment assets to an investment advisor that has the potential to protect capital in volatile markets, i.e., like InTrust Advisors. Yes, this is self-serving, but we believe the economic environment has changed and not for the better. You see throughout the last decade plus; the Federal Reserve and Other Central Banks have had your back by pumping trillions of dollars of liquidity into the markets. We are now through that period of insanity and the reverse is occurring at the same time that developed market demographics are ready to decline. The result is a weaker economic environment with an aging demographic that is spending less. The consumer has historically accounted for 70% of our annual gross domestic product or GDP. If they are spending less, this will be a drain on economy and investment markets. In fact, the largest of the generational demographic groups, the Baby Boomers, are now predominantly in liquidation and distribution mode. It will be years here in the U.S. before the next largest demographic group, the Millennials, are in their prime earning and spending years. Much of the rest of the world does not even have a Millennial demographic group. This spells demand destruction globally for years to come! There has never been a time like now and the risks to our economic way of life are substantial. However, we have had periods of excess in the past and the good news is we always make it through those periods. However, they take years to work their way through the economic system. In the past, I have written about Secular Bear and Bull cycles. These cycles are longer than typical economic cycles and the former generally are in place to rectify the ills of the past economic cycles that can only be fixed through a lengthy period of consolidation. As you can see below, there are cycles within the Secular period but the overall secular trend, bull, or bear, is the dominant force over the longer time period. 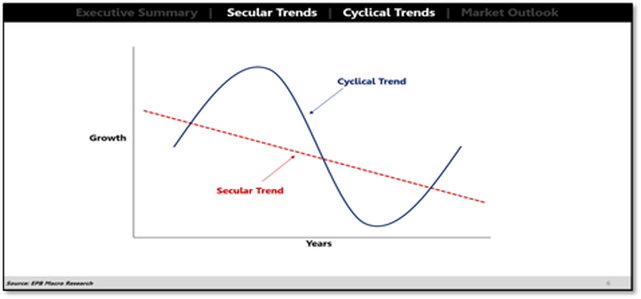 Let’s take a look at a few past such secular bear cycles to visualize what we might see in the coming years: 2000 – 2013 – The Lost Decade 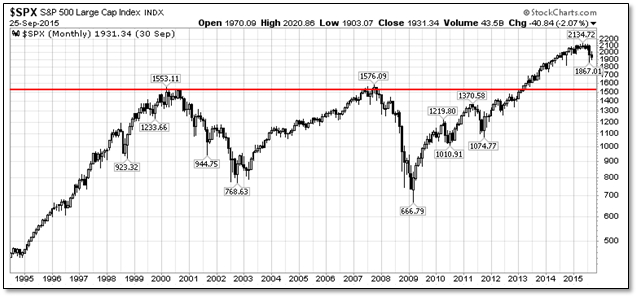 All Three Secular Bear Periods Over the Pasts 100 Years (1930 – 1950 – The Great Depression, 1968– 1980 – The Volker Inflation, and 2000 – 2013 – The Lost Decade) 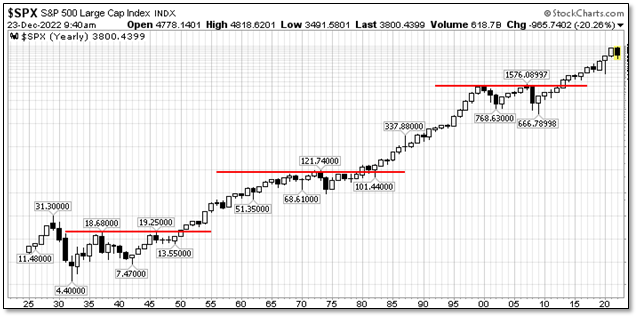 What do these periods have in common? Volatility and little long-term price appreciation over a decade or more for equity markets. Now for the moment, let’s assume you have bought into the idea that you should not be entirely in index products and tracking the major benchmarks. Yes, this worked great over the past decade, but what about during the cyclical bear market periods that I just highlighted and that may have just begun with the 2022 top in the markets? Each of these secular bear markets lasted about a decade or more and you would have made zero money on a price only basis without factoring in dividends. That is a scary thought, isn’t it? However, let’s say you were to mix in some active management utilizing some trend following type models. How would you do then? Let’s take the period of 2000 – 2013 – The Lost Decade. By applying a simple moving average and using it for timing in and out of markets, we greatly enhance returns in periods like this. A 0% return for the S&P 500 price index becomes a possible 4.5% return (or more) for the active manager and his clients, plus the ride was a lot less volatile! (See disclosures below) Yes, it is not perfect, and the portfolio still underperforms vs. historical market returns. However, if we mechanically follow these signals (for demonstration only) to sell when price drops below the gray moving average and buy when it moves above that same gray moving average line, it does keep you out of the worst of the sell offs and in most of the rallies to earn positive returns. This is called trend following and if we look at trend following (SG CTA Trend Sub-Index) vs. the S&P 500 index in periods like above, this is what you find: 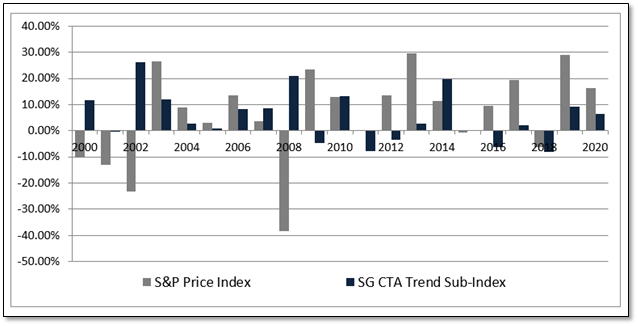 The trend followers tend to do better when markets are declining or in periods, like above, that are secular bear market periods, like 2000 to 2013, where markets are largely volatile, and range bound.
Now you combine this active management with higher dividend paying equities (Value stocks) as this is price only in the index, higher yielding bonds, some alternative type investments such as precious metals, volatility trading positions and commodities, you could just increase your odds of dramatically outperforming during these periods. Food for thought as you nurse your New Year’s hangover and plot your resolutions for the year! If we can help, please let us know. Disclosures Past performance is not an indication of future performance and there can be no assurance that the strategy will achieve results in line with those presented in this performance summary. This document is for informational purposes only and is not intended as an offer or solicitation with respect to the purchase or sale of any security. The 4.5% return for The Lost Decade of 2000 – 2013 utilizing trend following was based on using a 13-period moving average on a monthly price chart of the S&P 500. When price closed completely below the moving average, a sell signal was generated at the closing price for that month. When price closed above the moving average, a buy signal was generated at the closing price for that month. This is a purely hypothetical example and does not factor in trading costs, if any, slippage, interest earned on cash balances between buy and sell signals nor advisory fees. The S&P 500 is a capitalization weighted index of the 500 leading companies from leading industries of the U.S. economy. It represents a broad cross-section of the U.S. equity market, including stocks traded on the NYSE, Amex, and Nasdaq. The SG CTA Trend Sub-Index is designed to represent the performance of the 10 largest Trend Following CTA programs. To qualify for inclusion in the index, a program must be open to new investment, report returns on a daily basis, be an industry recognized Trend Follower, and exhibit significant correlation to trend following peers and the SG Trend Indicator. At the end of each year all CTA programs in the SG CTA database that meet the inclusion requirements are ranked by program assets. The 10 largest programs are selected as index constituents for the following year. At the beginning of the year a hypothetical portfolio is formed with each constituent program given an equal allocation. The index daily return is simply the daily return of this hypothetical portfolio. There is no rebalancing of allocations during the year. This has been one of the most challenging markets for both stocks and bonds that I have ever seen! Never during my investment career have both stocks and bonds lost so much on a combined basis in the same year. In other words, bonds usually act as a safety net for equities, but not this year. 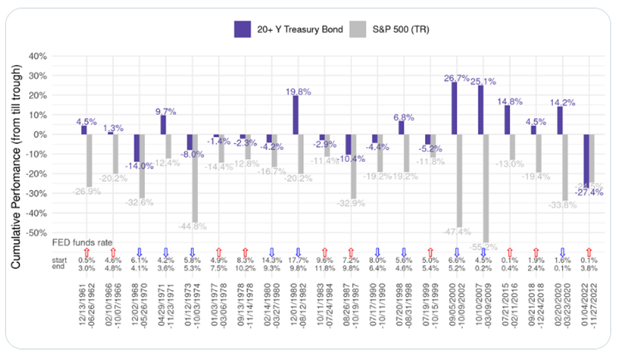 Even though equity losses are quite contained, overall investor sentiment seems worse because of those bond portfolio losses. Throw into the mix the extreme losses on crypto assets and the general feeling that we are headed for a recession and it’s no wonder that the average American is feeling down about their financial futures.  However, just like investing is for the long haul, so is staying rooted in the bigger picture. Markets move up and down and always have. Some years are better than others. Some years are just plain painful! However, time generally heals all wounds and allows us to achieve our larger goals.
The key is to keep focused on the prize and that is your personal financial goals or the big picture.
I could go on and on. Whatever the goal, that should be your focus. You should be making progress towards the goal and course correcting along the way. A bear market, like the one we are currently in, can set you back in the short-term, but hopefully your plan was built on longer-term assumptions. Here are five things you might want to examine to make sure you are still achieving your big picture goals:
If you are like most Americans, you probably have not revisited your plan in some time. It is like all things in life, you must revisit it from time to time to see how you are doing in moving towards the big picture goals. If you need help with the process or maybe you haven’t ever even developed a plan, please feel free to give us a call or click here to reach out to us. You would not know it from our portfolio positioning, but we believe the markets could bounce higher into the holidays. Why do we believe this? Market participants are too bearish on the equity markets. When sentiment gets this negative (see AAIA chart of Bearish Sentiment below), Mrs. Market tends to do what it needs to do to fool the largest number of market participants. In this case, that would be a significant market bounce. 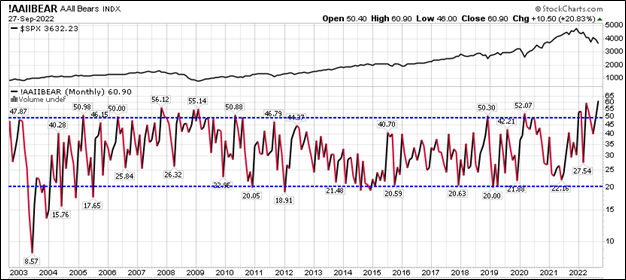 You can see that negative sentiment has never been this high in the twenty years that this survey has been taken by AAII. You can also see below that this pegs those investors in the Greedy camp, which is a dangerous place to be! 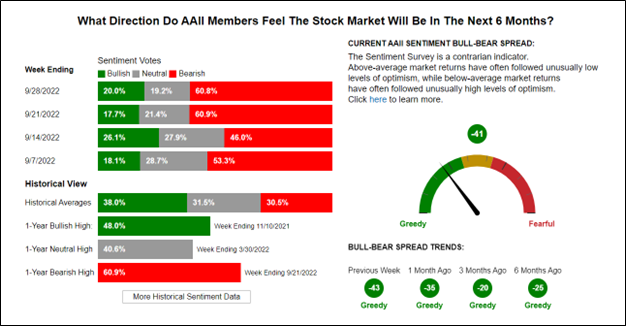 Courtesy of the American Association of Individual Investors. This means too many traders/investors are on the same side of the trade. There must be bulls and bears in roughly equal numbers to have a market. Risk shifts to extremes when that balance shifts to one side or the other (i.e., too many bears or too many bulls). I have to admit we are part of the traders on the same side of the boat just because the market seems unable to find solid footing for a sustained rally that would justify a shift in positioning. We are now trading at or below the June lows and we speculate that there may be another 3% to 4% downside until we potentially find an areas of support. 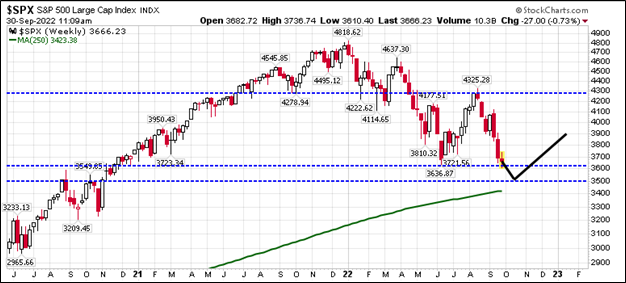 Again, this is just a guess at this point, but we believe a rally, like the June rally is possible into the seasonally strong months starting in mid-October through December. If that is the case, we will have to do some quick repositioning when that reversal does come to participate in that bear market rally.
Note, we are not saying the bear market is over, just that it is due for a rally that wipes out excess bearishness and probably brings excess bullishness in its place, just like at the August top. Good luck out there! Let us know if we can help you ride out these difficult markets and economic times with either better financial planning or better investment management solutions.  I did a mid-month market update for clients (and select prospects) where I made the case that the rally we have seen in July and the first half of August was doomed to fail and was purely a “rip your face off” Bear Market rally. Unbelievably, the bulls kept pushing the markets higher trying to front run the Fed. They were not rewarded as the Fed’s focus remains on taming inflation. Fed Chair Powell put the markets in their place in a rather short and pithy, eight- minute speech from the Jackson Hole Summit. The markets tanked, thereafter, with the Dow Jones Industrial Average down more than 1,000 points on the day dispatching the bulls and sending them home licking their wounds. So where do we go from here and what is your best course of action? So far in 2022 the peak to trough decline through June was -24.5% for the S&P 500 Index. We have since gained about 60% of that back in July and August. As a next step, it would make sense to me that we should at least retest the June lows. It doesn’t mean we will, but that would be an absolute in my mind if I was pulling the levers of the markets. Historically, speaking a -24.5% Bear Market decline would be the smallest of the past 100 years of Bear Markets. It is possible, but given all the intervention, quantitative easing and zero bound interest rates of the past decade, is a decline of -24.5% really what you would expect? I personally am looking for at least the average decline of the past 100 years (or roughly -35%), if not much more. The market declines much faster than the time required to push it higher, but it is still a process. This means we will have bounces along the way lower in a Bear Market, like the July/August bounce. Over the past two Bear Markets, we had at least 7 bounces that retraced 50-70% of the prior decline. There will likely be many such bounces (both large and small) on the way to the ultimate market bottom. We also believe a retest of the recent June lows seems probable and then the market will likely spend some time testing that level. We believe we take out those lows, but that is just a guess at this point. One thing I am certain is that the markets will be more volatile and will ebb and flow in whatever direction the market is trending at the moment, which at this point is down. It is highly unlikely that we will just grind higher (or lower) like we have seen over the past decade when the Fed was providing the markets with ample liquidity. In fact, the Fed is removing liquidity from the markets which means they are more likely to grind lower than the higher. It will be very important in the decade to come to have a steady hand on the rudder of your investments to navigate through the coming storms including rising rates, inflation, supply chain constraints, the redevelopment of key manufacturing capabilities here at home, demographic changes and more that we just have just not seen over the past 75 years of U.S. protected global trade. So now that I side stepped, going too far with my market forecast, let’s discuss the actions you can take to assure you prosper now and, in the future, to come. First, you need the right advisor. One that excels at protecting and growing capital in tough markets and one that can assist you in planning for such contingencies so that you reach your financial goals. Of course, we are biased, but we believe we are such a shop. Second, cash is King. It has been unfashionable to hold cash over the past decade or more, but right now cash is your best bet as an asset class as we enter a recession here and abroad. Hold whatever makes you feel comfortable right now and sleep well at night! However, be prepared also to deploy it at the right time. Don’t be lulled to sleep holding cash for the long-term as it is still likely to earn you less than the rate of inflation, which means it is losing purchasing power. Third, the absolutes of the past decade are now gone. No one really knows when the markets will bottom or if it is really a bottom until some time has passed. Therefore, you need to resort to some tried and true methods to both deploy and protect your capital. I wrote a post in May 2022 on Dollar Cost Averaging in Tough Markets. This is one such method to manage risk while also not guessing at market bottoms. Get used to averaging into and out of markets in the years to come. They will be more uncertain! Third, you need to be more diversified. The days of the 60% equity and 40% bond portfolio are behind us. Care to guess the top performing sector for the year? You guessed it? Energy. 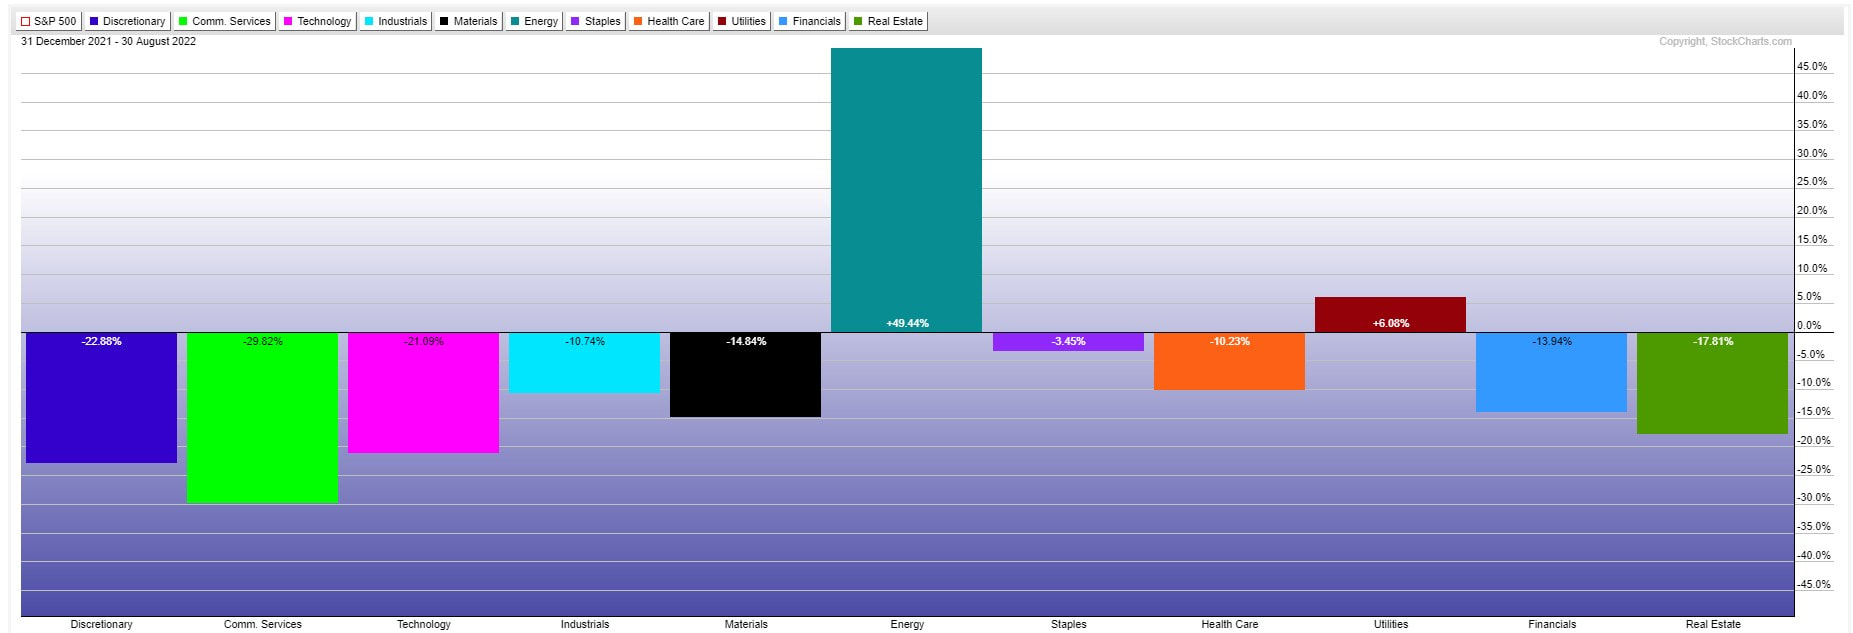 After years of underperformance, energy is now only 4.78% of the S&P 500 Index vs 28% of the S&P 500 in 1998. This means a passive equity fund plus bonds gives you only limited exposure to the top sector of 2022. With our clients, we have added alternatives allocations that include top sectors, commodities, currencies, metals, and liquidity trading managers. Bottom line, you need to diversify to broaden your exposure to both profit and protect capital in this kind of market.
Finally, seek out the cash flow generators. There is an old saying that a “Bird in hand is worth two in the bush.” That saying is very apropos today. We believe it is better to get paid cold hard cash than to wait on growth that may not materialize in the future. High dividend companies pay you today and they have more reasonable valuations vs. their growth stock peers. Guess what is the top paying dividend sector by percentage today? You guessed it energy. Let us know if we can help you today. Have a great Labor Day Weekend! |