|
Does it seem like the world has gone crazy? Just recently, we have witnessed Russia invade another sovereign nation in real-time and the coordinated response of just about every other nation on earth to that act. The poor people of the Ukraine I believe would argue that response has fallen woefully short, but that is an article for another day! Maybe you recently had a family gathering where some poor sole (usually me) brings up the wrong issue at the wrong time (usually politics or religion are good bets) and the entire event devolves into a war of words and hurt feelings. When have we been more divided and unwilling to meet in the middle? How about the truckers in Canada? In free societies, you should be able to voice your displeasure with your government that is supposedly “for the people and by the people” or I assume that should be the case in Canada. However, instead those truckers were arrested, and their trucks and assets confiscated for expressing those same freedoms! I repeat, “has the world gone crazy?” In my study of past market history, it appears to me that we have entered a cycle or war and conflict like the early part of the twentieth century. This is a change from the last 40 years of relative calm! We have blown financial bubbles about as far as we can blow them. We have rewarded the rich and punished the poor and middle class. We have dug ourselves under levels of debt never before seen and now is the painful time in history where these secular excesses must be righted. 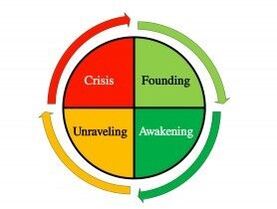 The Cycles Throughout History For Americans, this last happened in the late 1920s and early 1930s and resulted in the Great Depression and the Stock Market Crash of 1929. Are we looking at the same risks today? Some call this period in long-term cycles, the Fourth Turning, as outlined in the book by the same name by Strauss and Howe. The Fourth Turning is a Crisis. This is an era of destruction, often involving war or revolution, in which institutional life is destroyed and rebuilt in response to a perceived threat to the nation's survival. Notice that institutional life is destroyed (code for turned upside down) and rebuilt (code for painfully restructured). As investors, we must realize this period can seem apocalyptic, but it is also full of opportunities, but we must change our institutional processes and cannot stay stuck in what worked the last forty years. We must adapt! A frequently referred to white paper by Artemis Capital Management entitled The Allegory of the Hawk and Serpent did a great job of identifying these cycles and what worked historical over the past 100 years through all cycles. They called this Fourth Turning “the Hawk” in the white paper and identified it as the end of a corrupted growth cycle. They called it a period “where extremes exist including a deflationary path, whereby an aging population leads to low inflation, faltering growth, a financial crash and then debt default.” Further, they highlight that this path “might be followed by an inflationary period, with fiat default, and helicopter money.” Neither path is, they say, mutually exclusive, and they claim they occur sequentially. In their analysis, they called these periods “Secular Declines.” Some say a picture is worth a thousand words, so let’s see what worked in these periods. Let’s start with interest rates (i.e., Fixed Income) and equities (the institutional processes of the past 40 years). 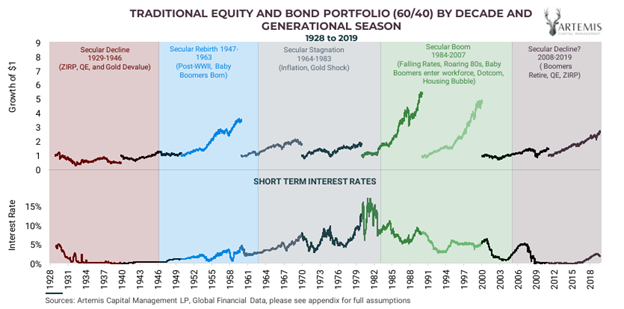 The period of Secular Decline is on the far left and it has begun on the far right, according to Artemis Capital Management. What you can see is equities produce meager returns over the complete cycle compared to other cycles and historical averages for returns. Interest rates stay so low they don’t reward investors at all. In fact, after factoring in inflation they were likely negative real rates (i.e., yields less the rate of inflation). I would also speculate that passive management of assets is also bound to underperform during these periods due the rise in volatility (outlined below). If rates were to stay as low as in the 1929-1946 period, fixed income (i.e., bonds) would also be traded and I would argue alternatives found for some of that allocation. Artemis makes the case that volatility picks up and interest rates start to rise, while valuations must fall for equities in Secular Declines. This all seems pretty basic when you consider that equity valuations have never been higher, interest rates have rarely been lower, and volatility died during the past decade and only recently has it started to rear its ugly head again. Artemis then shows what has worked during Secular Declines. 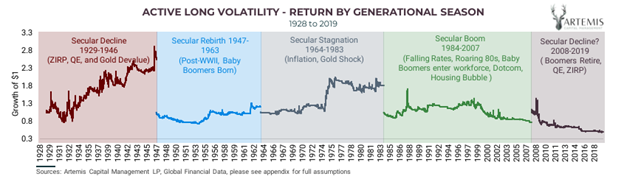 I don’t believe this means buying and holding the Volatility Index or VIX, but rather the active trading of volatility spikes by buying low and selling high and the reverse for those who can short. 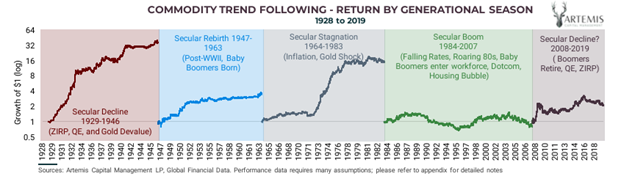 When I came into the business 25+ years ago, commodities were part of most portfolios. It is amazing how poorly they performed since 1984 and how recently we have witnessed a resurgence in such holdings. Could this be the start of a new commodity super cycle as was the case in 1927 to 1946? 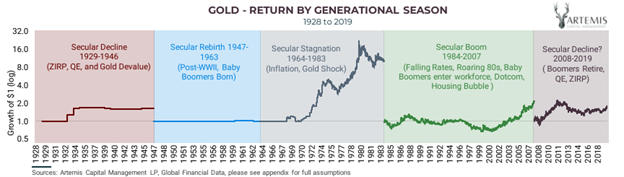 Gold, likewise, has been pretty quiet the past decade or two. We are just now seeing gold and precious metals starting to perk up. Could this be a time for them like the Secular Decline of 1929-1946 or more probably 1964-1983 when there was rampant stagflation? I reference the latter because the former was dominated by the peg of gold to a price of $35 per ounce as it was a very important part of the monetary picture. Today, gold does not back any currencies that I am aware, and it is more of a hedge against on unsound budgets and fiat currencies. 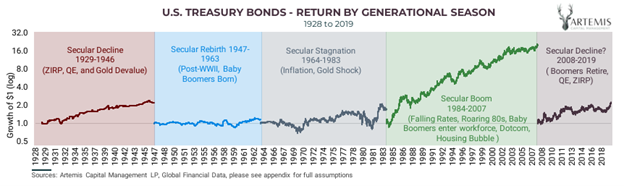 Finally, we have Treasury Bonds, which did surprisingly well. I believe you can point to the exceptionally low interest rates during the 1929-1946 period for that result. I personally believe fixed income must be traded in the current Secular Decline. Held when rates fall and traded out of or hedged when rates rise.
Unfortunately, no two periods of time are exactly the same or you would just buy the four asset or asset classes above and be set. But no, it takes a keen knowledge of the past and I believe a quicker finger today to move to the right places, especially during periods of institutional destruction like we are experiencing at present. This is where we come in, we can help you survive and maybe thrive. We have both active and passive solutions that we combine into total solutions for clients. Our passive solutions include alternatives in the areas outlined above plus more traditional holdings. Let us know if we can help.
0 Comments
Last week was a very busy week! Frustratingly, it ended pretty much flat after the mother of all short covering rallies in the closing minutes of Friday’s trading session. I say "frustratingly" because I held onto more growth-oriented positions until Friday waiting on a bounce. When it did not appear the bounce would occur at these levels (see March 2020 decline for reference), I decided I had better cut bait and sell out of many of them. Not ideal timing, but I did add back a little of that exposure on Monday for a trade post the short covering rally. So where do we go from here? Great question! Over the weekend, I listened to advisors and managers make the case for the Fed to capitulate and markets to reverse higher all the way to the opposite extreme of the Fed is trying to crash the markets. I honestly can say there is no general consensus! So, we turn to the charts, they can sometimes help when the markets appear confused and there is no clear path forward. 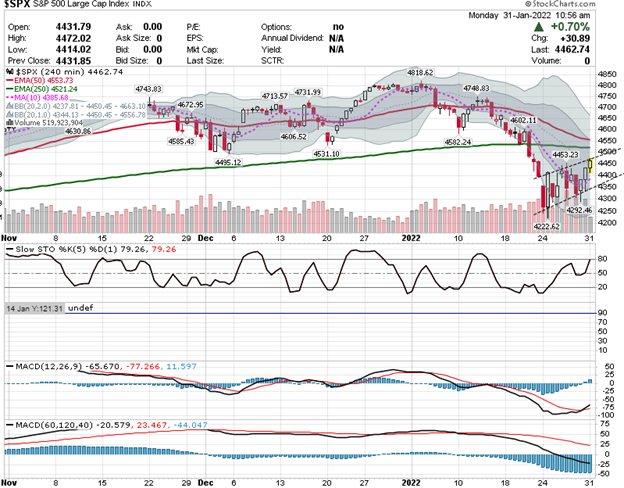 Above is a 4-hour chart of the S&P 500 Index. What you will notice on this chart is the market is bouncing but within what we call a Bear Flag (the area between the two dotted back lines). What does a Bear Flag typically mean? It usually is a continuation pattern that in this case could resolve itself lower. If we took the recent all-time high of 4,818.62 and subtracted the recent low of 4,222.62, we get 596 S&P 500 points or roughly 600 if we round. If we then measure 600 points lower from the top of the Bear Flag pattern (estimated at 4,500), that gives us a rough target of 3,900 on the S&P 500 or another 13% lower. Top to bottom this would give us a 19-20% correction. I think this is a real probability in the coming weeks. Now the disclaimer – this is just a guess. Anything could happen from the Fed getting dovish to seven rate hikes, as Bank of America is now forecasting over the next two years. I will say this, the next four months will likely be very volatile! I expect there is a great deal of pressure on the Fed to deal with inflation, even if it ends up being transitory. This could mean they lean towards a larger number of rate increases and risk pushing the economy to the brink or into recession. It will be a delicate balancing act; one the Fed usually gets wrong historically as you can see below! 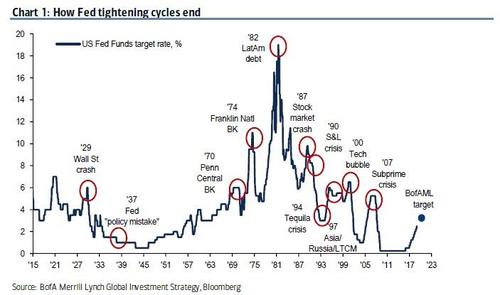 Summary
The Year That Was Happy New Year to all our readers! 2021 was a fabulous year if you invested almost entirely in names, such as Apple, Microsoft, Nvidia and Tesla in 2021! Here is their performance relative to the S&P 500 index. 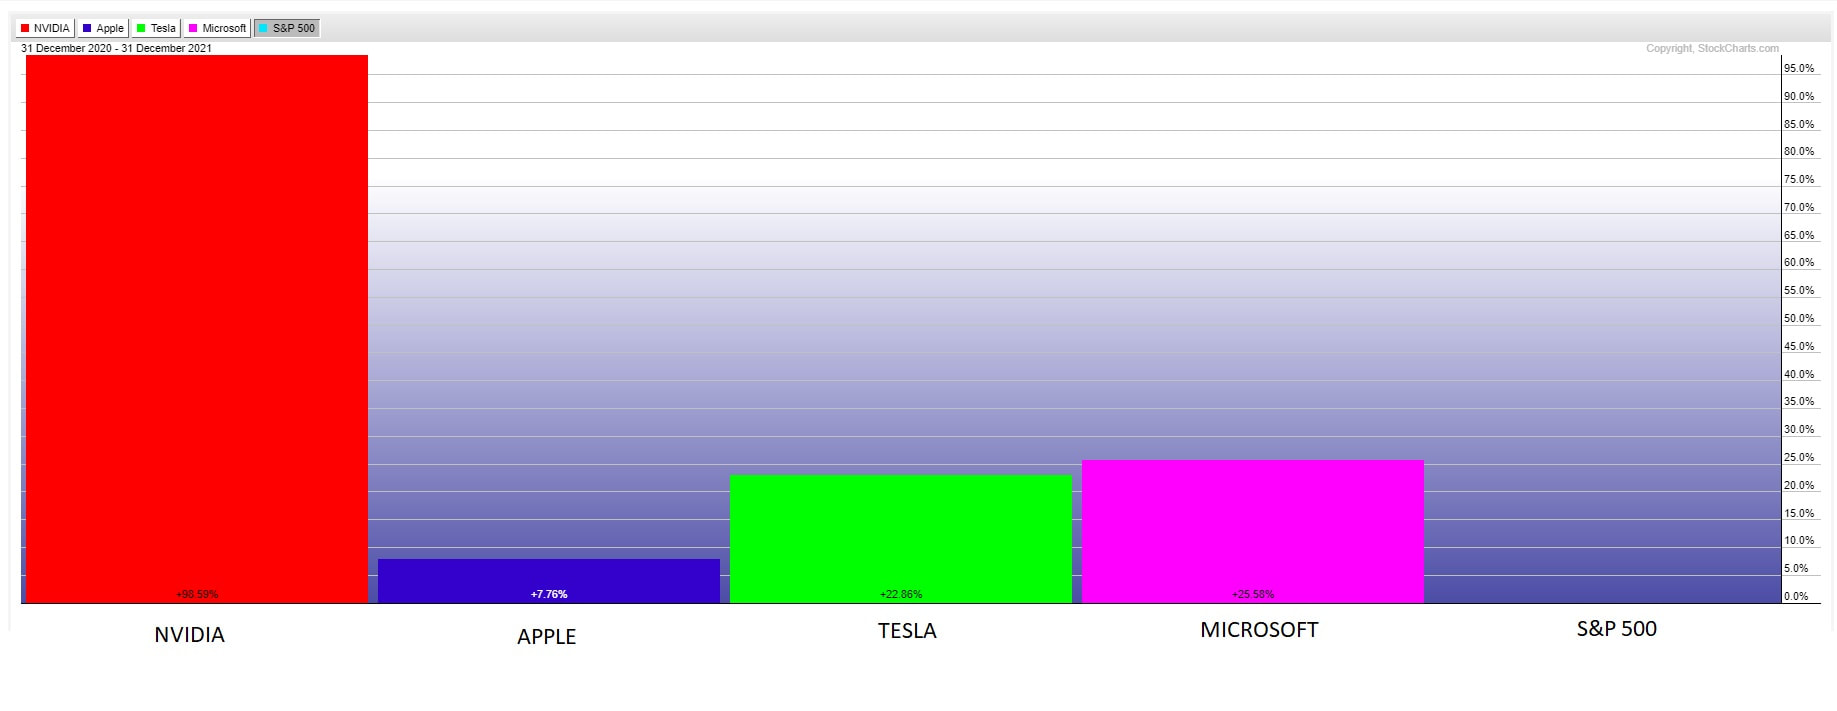 You can see that they all outperformed the S&P 500 index for the year on a relative basis. Otherwise, the S&P 500 index (in red) ruled the day, because of those four names, and an end of the year rotating bear market in many other names that wreaked havoc in other indexes. 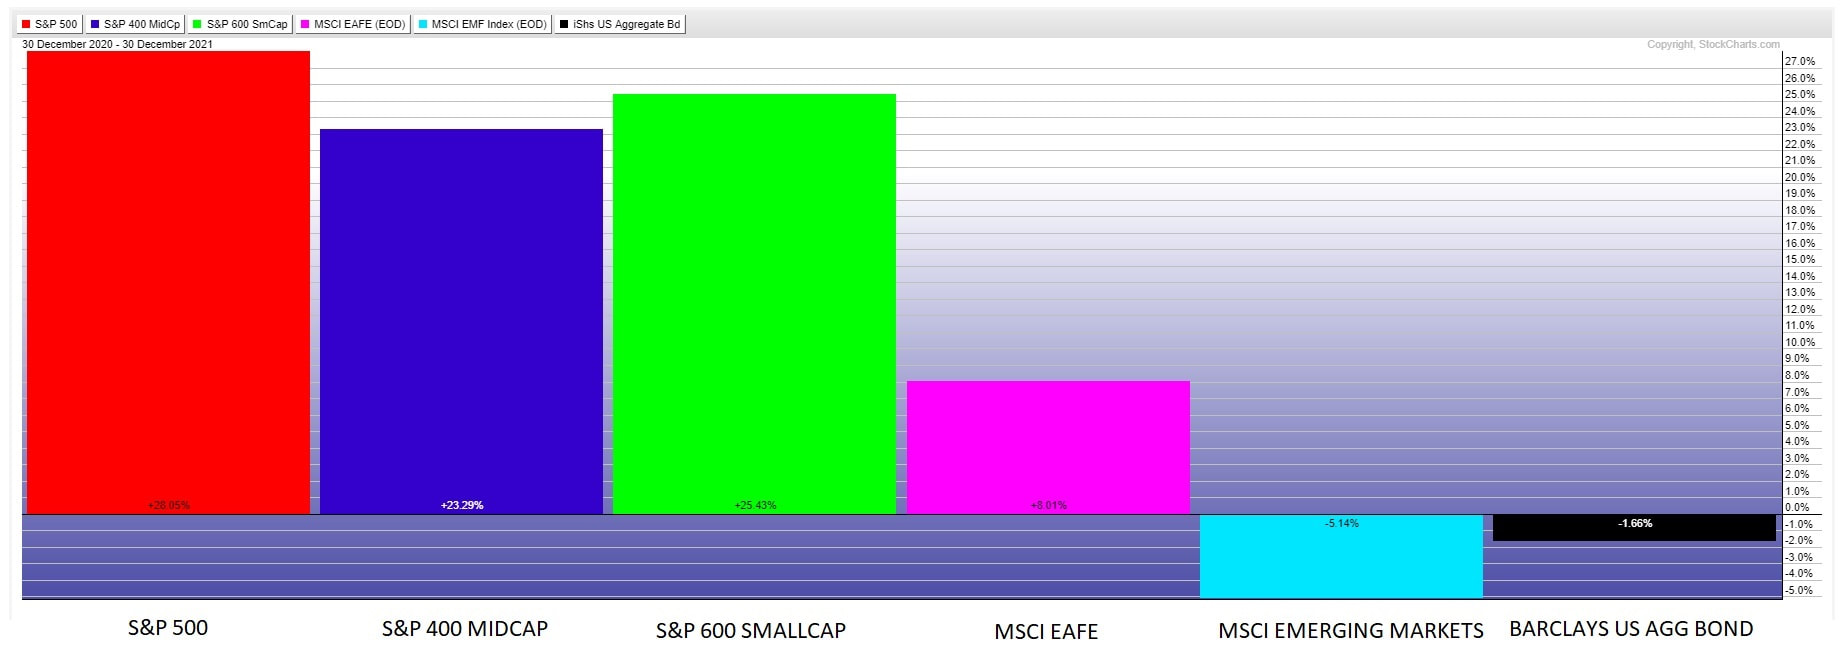 The Year Ahead (What is to Come – Possibly) 2022 stands to be a more challenging year than 2021! However, let’s remember a couple of things that recent history has taught us.
Here is the U.S., the Federal Reserve has started to taper the purchase of treasury securities and plans to raise the Fed Fund rate starting in mid-2022, which would usually have the effect of lowering demand for our U.S. treasuries and raising interest rates. This is exactly what has happened with short-dated bonds, but longer dated bonds are still trading in a consolidation range, possibly signaling that the bond market thinks the Fed is too late and that inflation is already moderating (remember deflation usually follows inflation). The increase in the rates of short-term bonds is why the Barclay’s Aggregate Bond Index lost -1.77% in 2021. Despite the constant negative news and bear market predictions, we think there is a decent chance that the overall market continue higher. Here is why? The S&P 500 index RSI is trending above 70 (top indicator, circled in green). When this indicator is above 70, it tends to stay above for 14-15 months on average and lead to strong gains of more than 24% on average. Given the current run above 70 on the RSI, we can project another 3-4 months of positive to sideways market returns and +3.33% based on the historical averages. This is the average, and it should be noted that the longest such run since 1997 was 27 months in 2013-2015 and this resulted in a market gain of more than 39.1% over that period. We believe it is possible, we stay above the 70 RSI mark for much of 2022. Of course, that is just a guess and certainly past performance is never a guarantee of future performance! 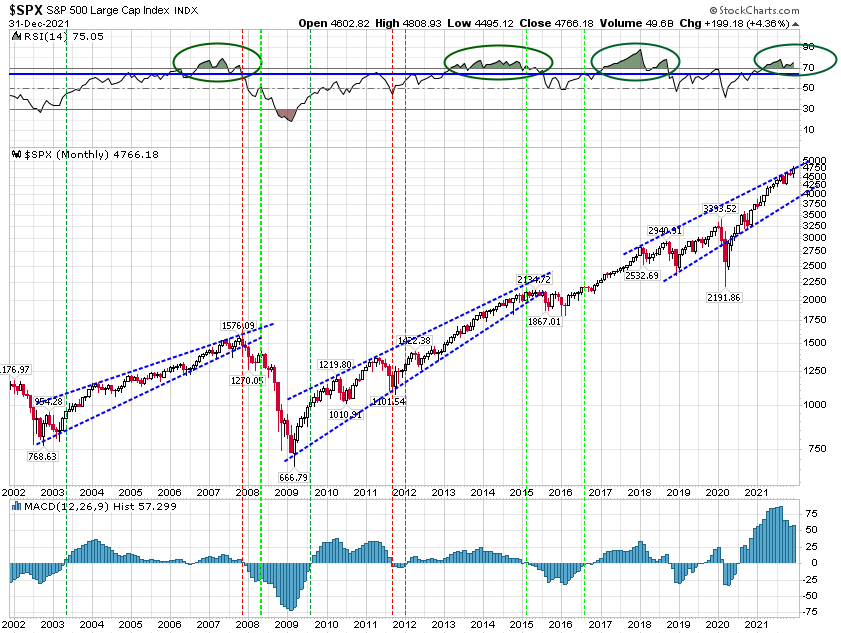 The other reason? Fed tapering and rate increases don’t cause Bear Markets. Policy errors, such as raising rates too much or too fast, cause Bear Markets. As you can see below, when the U.S. Federal Reserve has raised interest rates in the past (the orange line), the S&P 500 index has continued to climb. It is only when rates went too far, and the Fed starts to flatten or reverse rate hikes that the market falls. If you look at the three historical periods of rate increases, below, you had roughly a year in which the markets rose, and rates also increased in each case. The Fed does not plan to start raising rates until mid-2022 and this is why we think 2022 could be volatile but generally positive return year. 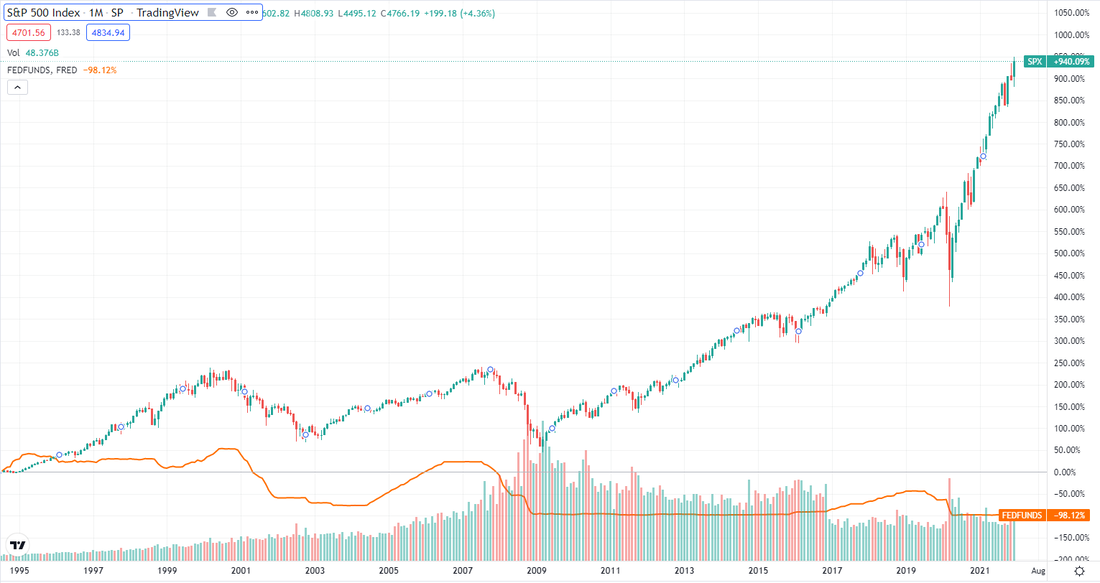 Now the disclaimer. Not every index may rise. Many such as non-U.S. markets could struggle over the entire year. To us it looks like non-U.S. markets are oversold, could rally higher and then resume their struggles, but this is pretty tough to forecast.
We are still advocates of broadening diversification, but 2022 could prove another year of narrow leadership. It might not be until 2023 that a Central Bank policy error occurs, and diversification finally works to narrow losses, but we can save that for another post. Disclaimers/Definitions This information is for educational purposes only. Please do not rely on this forecast nor trade based on it. Past performance is not indicative of future performance. The S&P 500 Price Index is a capitalization weighted index of the 500 leading companies from leading industries of the U.S. economy. It represents a broad cross-section of the U.S. equity market, including stocks traded on the NYSE, Amex, and Nasdaq. The S&P MidCap 400 Index, more commonly known as the S&P 400, is a stock market index from S&P Dow Jones Indices. The index serves as a barometer for the U.S. mid-cap equities sector and is the most widely followed mid-cap index. To be included in the index, a stock must have an unadjusted total market capitalization that ranges from $3.2 billion to $9.8 billion at the time of addition to the index. The S&P SmallCap 600 Index (S&P 600) is a stock market index established by Standard & Poor's. It covers roughly the small-cap range of American stocks, using a capitalization-weighted index. To be included in the index, a stock must have a total market capitalization that ranges from $700 million to $3.2 billion at the time of addition to the index. As of 31 December 2020, the index's median market cap was $1.26 billion and covered roughly three percent of the total US stock market. These small cap stocks cover a narrower range of capitalization than the companies covered by the Russell 2000 Smallcap index which range from $169 million to $4 billion. The MSCI EAFE Index is designed to represent the performance of large and mid-cap securities across 21 developed markets, including countries in Europe, Australasia and the Far East, excluding the U.S. and Canada. The Index is available for a number of regions, market segments/sizes and covers approximately 85% of the free float-adjusted market capitalization in each of the 21 countries. The MSCI Emerging Markets Index reflects the performance of large-cap and medium-cap companies in 27 nations. All are defined as emerging markets. That is, their economies or some sectors of their economies are seen to be rapidly expanding and engaging aggressively with global markets. The MSCI Emerging Markets Index currently includes the stocks of companies based in Argentina, Brazil, Chile, China, Colombia, Czech Republic, Egypt, Greece, Hungary, India, Indonesia, Korea, Kuwait, Malaysia, Mexico, Pakistan, Peru, Philippines, Poland, Qatar, Russia, Saudi Arabia, South Africa, Taiwan, Thailand, Turkey, and the United Arab Emirates. The iShares Core U.S. Aggregate Bond ETF seeks to track the investment results of an index composed of the total U.S. investment-grade bond market. The federal funds rate refers to the target interest rate set by the Federal Open Market Committee (FOMC). This target is the rate at which commercial banks borrow and lend their excess reserves to each other overnight. The FOMC, which is the making body of the Federal Reserve System, meets eight times a year to set the target federal funds rate, which is part of its monetary policy. This is used to help promote economic growth. It seems today that there is a law firm on every corner and at every social event you can’t reach out your arm in any direction without hitting an attorney. I believe the only more prevalent professions seem to be financial advisors and real estate agents. I frequently joke that I can go to any event, throw my pen indiscriminately and hit another financial advisor. This may not be exactly factual, but it is probably not too far from the truth given the extended term of this current bull market!  How about you? Have you ever watched late night or free over the air waves digital television? If you have you have probably witnessed the continuous barrage of law firm commercials claiming they are serving your rights and can get you the “settlement you deserve.” If you had just landed here from another planet, you would assume that all earthlings do is sue each other!
Surprisingly, the National Center for State Courts (NCSC) analyzed civil lawsuit data for 26 states. The NCSC found that tort cases—those involving an injured party seeking damages from a negligent party—made up less than 3% of all civil cases in 13 of those states, 3-5% of civil cases in 8 states, and 5-8.2% of civil cases in 5 states. Moreover, product liability cases and medical malpractice claims made up less than 1% of civil cases. The majority of civil caseload is made up of contract and small claims cases. They also found that tort cases in the U.S. are on the decline. In 13 states, tort filings decreased by 25% from 1999 to 2008 Does this mean you can live recklessly, party like it’s 1999 and ignore the risk of lawsuits? Obviously, the answer is “no”, especially if you are affluent! There are still over 286,289 civil case filings every year in the U.S. according to 2019 U.S. District Court records and that number is growing at a 3% rate annually. That is a large number of civil lawsuits to be sure! There is no statistic for this, but I would wager that most of such civil suits target the wealthy over the poor since they are the ones with the assets and deeper pockets. So, what is the solution? Should you cower in fear in the corner? Move to the most isolated place on earth and hope no one finds you? Obviously not! The answer is to arrange your affairs in such a way as to minimize your exposure. We recently landed a new client who owned substantial real estate holdings. This client had no liability nor property insurance on any of their real estate holdings. These properties were owned by them individually and not in any entities. I should also mention this couple had substantial other assets and made a significant income from their business interests. However, they had failed to stand back and see the impact of that income on their net worth and the amount of assets that were now at risk. It was no longer just a given property that would be at risk but potentially the entire portfolio, their income, and other assets. In talking with them, we discussed the possibility of loss from fire or other hazards on their rental properties and they were very comfortable with such risk. However, when we reviewed their current structure, we determined that we could greatly reduce the risk of a frivolous lawsuit just by arrange the properties differently and looking at purchasing liability coverage on the portfolio of such holdings. We are currently working with their legal counsel to put each property in a separate limited liability company (LLC) with 100% ownership by a holding company. We are also setting up a separate property management entity to oversee each property’s management, collections, and payment of expenses. Yes, this structure will cost a few dollars to set up and it will increase their annual costs some, but it will also significantly reduce the chance that a frivolous lawsuit from one of their properties, tenants, or visitors to the properties, impacts their other business income or asset holdings. By the way, this all came about because the underlying client asked if we could help them with the accounting for their real estate properties. When we first looked at the bigger picture, we noticed the larger risk and opportunity to help reduce this risk. The question I then have for you is “how can we help you today?” We are not just an investment advisory firm, but a complete family office solution for affluent families! Maybe it would be worth exploring how we can simplify your life and allow you to pass more to your heirs, while minimizing the impact that creditors and your dear broke Uncle Sam has on your assets. Why not connect with us today?  I get asked frequently "how can I find a better yield on my cash deposits?" The answer - "that one is a hard one! How much risk are you willing to take to get higher yields?" Their response is usually "no more than I am taking now at my local bank." The problem is that the Federal Reserve (the "Fed") has those seeking yield in between the proverbial rock and a hard place. The Fed policies of buying outstanding debt (i.e., quantitative easing) to keep rates on treasuries low and, thereby stimulate economic growth, have really hurt savers. They have also forced investors to take greater risk to earn higher investment returns so they at least keep up with inflation. This in turn has created bubbles in many asset classes that have significantly stretched historical valuations and investment risk metrics. So what is a yield starved investor to do? Today we will explore a handful of options. However, I don't think any of these options is a singular answer. Instead a diversified approach may be your best option in this challenging environment! 1. Crypto Stable Coins I mentioned crypto stable coins like Tether, USDC and UST in a recent post called Miscellany. For instance, I converted U.S. dollars into USDC stable coin and then put it on deposit at several crypto banks and now earn north of 8% on those funds. The downside? Crypto is lightly regulated and the SEC is now stepping up it's reviews of stable coin providers and their underlying reserves. In my personal case, I didn't put more than I could afford to lose in stable coin and I split it up amongst several U.S. based crypto banks. You can find out more about this option in an article entitled What are Stablecoins and Why Invest in Them? 2. High Dividend Stocks There are high dividend stocks and stock funds such as Amplify's High Income ETF(symbol YYY) which currently yields 9.04%, according to ETF database. The problem with high dividend stocks are 1) they have high dividends usually due to a price decline or a high degree of investment risk and 2) if markets go down, the yield will rise but any gains here will be offset by unrealized losses in the underlying stock or ETF. Take a look here at YYY (red line) vs. the S&P 500 ETF (SPY) (blue line). 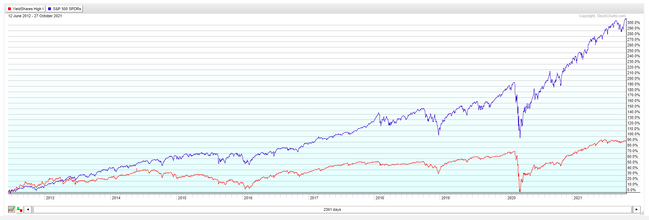 Wouldn't you rather have had the return of the S&P 500 when it appears you are taking a lot of risk in the Amplify High Income ETF based purely on comparing the periods of market decline for both securities? A solution here might be to actively trade or apply a trading methodology to ETF, but even so you could do that to the S&P 500 as well and earn a higher overall return. 3. Total Return Strategies With total return strategies, you are not looking for yield, but a greater overall portfolio return. Instead of distributing income to support your lifestyle, you periodically raise some cash and make distributions from principal. We recently released a total return strategy for enhancing cash returns. It allocates between 65-80% of the portfolio assets to fixed income ETFs that are chosen based on their yield adjusted duration. The idea here is to get as much yield per unit of duration (e.g. a measure of a bond's or fixed income portfolio's price sensitivity to interest rate changes) as possible. It pairs that with a diversified portfolio of buffered ETFs where each position has both a known floor (loss) and capped upside. Essentially giving up some potential upside for a lower downside. The result: 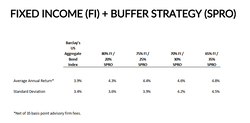 Disclosure, these results above are ALL back tested using the CBOE S&P 500 Buffer Protect Index Balanced Series plus the Barclay's Aggregate Bond Index. This former index may not exactly match the diversified index of buffered ETFs. Past performance is not indicative of future performance.
Now that we have that out of the way, you can see that based on this historical data since 2006, we where able to enhance overall total returns with less risk (i.e., standard deviation) at least in back-testing. 4. High Yield Teaser Rates The final area where you can get enhanced yields in from internet firms offering teaser rates for new customers. Bankrate.com has a whole list of such firms, mainly internet banks offering yields of around 50 basis points at present. The difficulty we have found with such rates are they are only available to individuals, not businesses and each has minimum deposit amounts and restrictions. 5. A Diversified Bond Portfolio One final option might be just a plain old fixed income portfolio. With the right allocation, you can get yields north of 2.5%+ and durations as low as 3.08. We do this for clients and also change positioning from time to time to minimize downside when rates escalate as they have been recently or capture more gain when rates decline. Final thoughts One of the frustrations for yield oriented investors is there is no one place you can put your hard earned capital and earn high yields and have FDIC protection. However, I think it is also clear that there are a number of options that when mixed and matched could provide you with the overall yield you desire and enough diversity to potentially minimize losses if equity or bond markets decide to sell off. Let us know if we can help. |