|
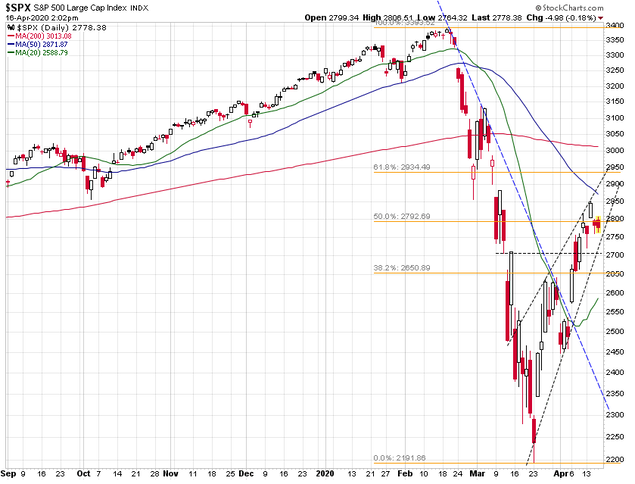
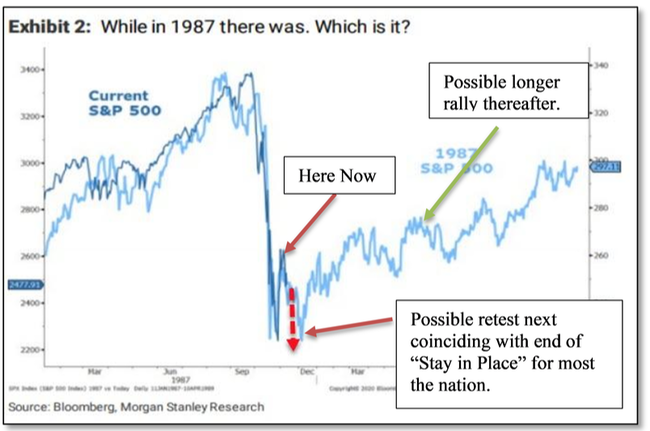
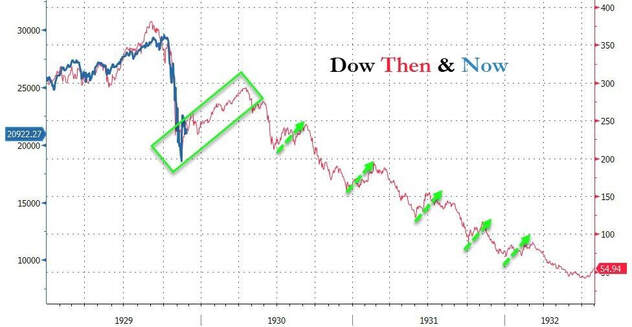
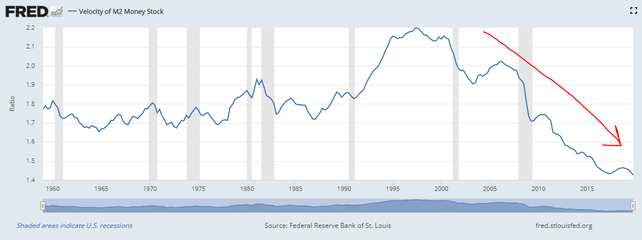
In our prior post, we talked about a possible Minsky Melt Up if the monthly Relative Strength Index (RSI) closed the month above 70. A late February sell off doomed that possible indicator signal and the outbreak of the Coronavirus quickly pushed us into an unexpected Bear market in March. Not exactly what we were hoping for when we made the post! In fact in the midst of the panic selling, I echoed the words of Ray Dalio of Bridgewater Associates L.P. (manager of the world's largest hedge fund) when describing this decline “we did not know how to navigate the virus and chose not to because we didn’t think we had an edge in trading it. So, we stayed in our positions and in retrospect we should have cut all risk.” In our case, we cut risk, but not enough nor fast enough. We also did not expect the decline to be so sharp and deep. As we noted on many occasions through out the month, we expected a market bounce and told clients we would adjust exposure at that time. 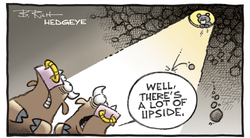 It took massive new interventions from the Fed and other Central Banks and unprecedented fiscal policy to finally bring some stability to markets in the largest collection of aid packages ever. Where we stand now is that the market is still in the aforementioned bounce. We call these rallies affectionately “dead cat” bounces. They feel good but do not last (usually)! In fact, since the 1950, there have been 15 such bounces and all but one retested the lows of the initial decline. This one could defy the odds, but the betting man would wager for a retest of the market lows. The current bounce is within a pattern that we call a bearish rising wedge. This pattern typically breaks to the downside as it reaches the top of the pattern, which is where we are right now. Also note that we have currently recaptured about 50% of the decline in March. A typical bear market bounce will recapture between 38.2% and 61.8% of the market decline. What Is Next?As I mentioned the next move in the bearish wedge pattern is to the downside. According to thepatternsite.com, once the bounce completes, price resumes declining, averaging 30% from the bounce high to post bounce low in 49 days. This places price an average of 18% below the event low 67% of the time. We expect a scenario could unfold much like what occurred in 1987 where a market bounce led to a retest of the lows (or possibly new lows this time around). Like 1987, we expect that this retest will start soon with it culminating around the same time the “Stay in Place” restrictions are lifted for most or all Americans. It is possible the market then starts to feel better about Americans getting back to work and we enter a period, like above or the green box below, where we rally for a number of months. The problem we believe is that the economy will not come back as fast or get back to the levels previously experienced, which will lead to further possible market declines as shown in this chart from 1930-1932. This is the classic Bear market! Now this is just a guess, but this could be how it unfolds. We think the challenge will be that initially, the decline, the virus and the global standstill for business are all deflationary. This means citizens will be hoarding cash and not spending, which will exacerbate already low levels of monetary velocity (i.e. exchange of monies from one person to the next and the next) here in the U.S. You can see below that the velocity of money has already been declining for most of the past twenty plus years. To counteract this low level of spending and declining velocity of money, the Central Banks will continue to buy every asset not tied down, global governments will continue to implement generous fiscal programs and even more Modern Monetary Theory practices, like the $1,200 per adult that is being distributed to taxpayers under the Cares Act currently in the U.S.
However, its possible that when the dust settles and global citizens start to feel better their situation including spending again, the huge amounts of currency and deficit spending that have been pumped into the system will spur a bout of hyperinflation the likes of which we have never seen. This will be the time when the velocity of money turns up from its current downward trend. We feel that the last ten years were the period of the passive buy and hold manager and the next ten years could easily see the return of the active manager given the volatility we could see and the bouts of deflation and then inflation we could experience. What are your thoughts? How about leaving us a comment below?
2 Comments
4/16/2020 09:15:59 pm
By the way, the futures are currently up big on Gilead's news of drug effectiveness. I looked at Gilead just a few days ago and passed on buying it...oh to go back in time.
Reply
4/18/2020 10:41:54 pm
The bears did push prices lower post opening but the bulls fought back.
Reply
Your comment will be posted after it is approved.
Leave a Reply. |

