|
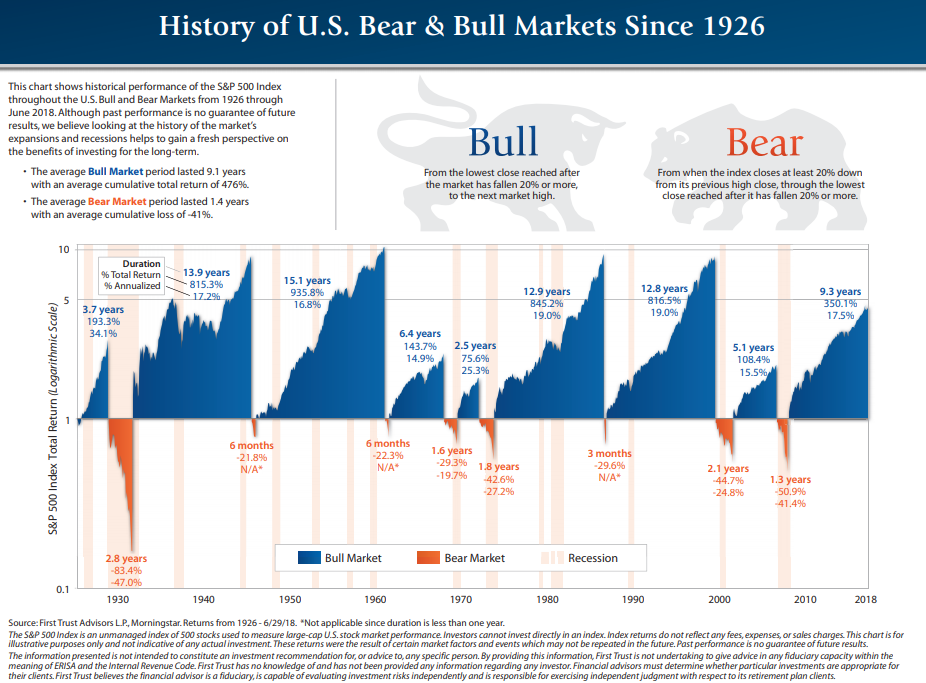
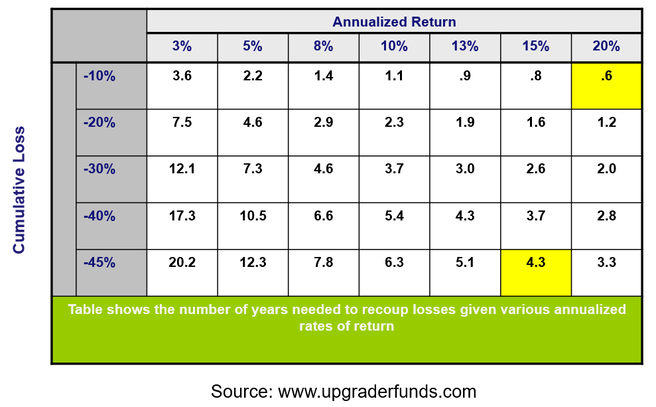
According to many market watchers, August notched a new milestone for the current bull market. It marked the longest bull market in terms of days in history as it eclipsed 3,453 days on August 22nd. Of course, many would argue that this depends on your starting point. Some would argue that we had a bear market (defined as a correction of greater than 20%) in 2011 and so the end of that correction is the starting point of the current bull run which then greatly shortens this calculation. From our perspective, who cares! Let’s ride the bull market as long as it wants to keep moving up. The longer the better! When the bull market does finally signal the end, our process will help us move aside or hedge our remaining positions to minimize those losses. In the early days of my career, I tried to predict market tops and was wrong almost 100% of the time, but not anymore. I have no idea! Oh, I can tell you that we are probably much closer to the end statistically than the beginning! I would probably even warn you that you need to know where the exit sign is because the average bear market is no picnic! Technically, I can probably warn you at the correct time that it appears the market is ready to move lower. However, I cannot guarantee you that that correction will turn into a bear market and that we have seen a top, except in retrospect. The last few words here are key here! As trend followers, our models are not predictive. They are reactive. We will only know a turning point in retrospect and then we react. So how much of a shine would the average bear market take off the average American’s portfolio? Is this even worth worrying about? As you can see in First Trust/Morningstar chart above, the average bear market lasts 1.4 years and brings a cumulative loss of -41%. Let that sink in a bit! If your current portfolio value is now $425,000 at the end of the average bear market it will be worth just $250,750 at the bottom. That is quite a hit! According to First Trust/Morningstar, the average bull market rises 9.1 years and 476%. So how long then does it take to recover this 41% hit ? The answer is? It depends! If we use an average of the annualized bull market returns from the First Trust/Morningstar chart, that would be approximately a 20% annual return, so roughly 2.8 to 3.0 years.
Quite honestly not as long as I had expected and certainly the bull market returns at almost 20% per annum are more than I would have guessed. However, what if instead of losing 41%, your portfolio value, you only lost 10% (or maybe even made money as we believe we can do with a couple of our portfolio solutions)? Well happy days! The recovery period at an annual return of 20% in a bull market assuming a 10% bear market loss is just .6 years. In our case, I would be shocked if our clients lost 10%. We believe 5-6% is probably the maximum and that further shortens this recovery period to just .3 years or 3.6 months. What this means is that our clients are in theory enjoying market profits much faster than the person who just buys and holds through entire market cycles. The buy and hold investor must wait almost 3 years to get back to break even before they can start earning new returns. If fact, this period to break even is usually even longer because the average investor does not usually do as well as the market averages. According to the Investment Company Institute and Real Investment Advice.com, the average investor underperforms the S&P 500 index by almost 38%. Assuming that is correct, the recovery period for the average investor now grows to 4.5 years. Let’s assume we investment just as badly (not likely) and our recovery period on a 10% loss grows from .6 to .96 years (almost 1 full year). Which scenario would you rather have? A one-year recovery or a 4.5-year recovery? The choice is yours, but if you are like most Americans, it may be time you focus more on that exit door and give us a call! Written by: Jeff Diercks
0 Comments
Your comment will be posted after it is approved.
Leave a Reply. |


