|
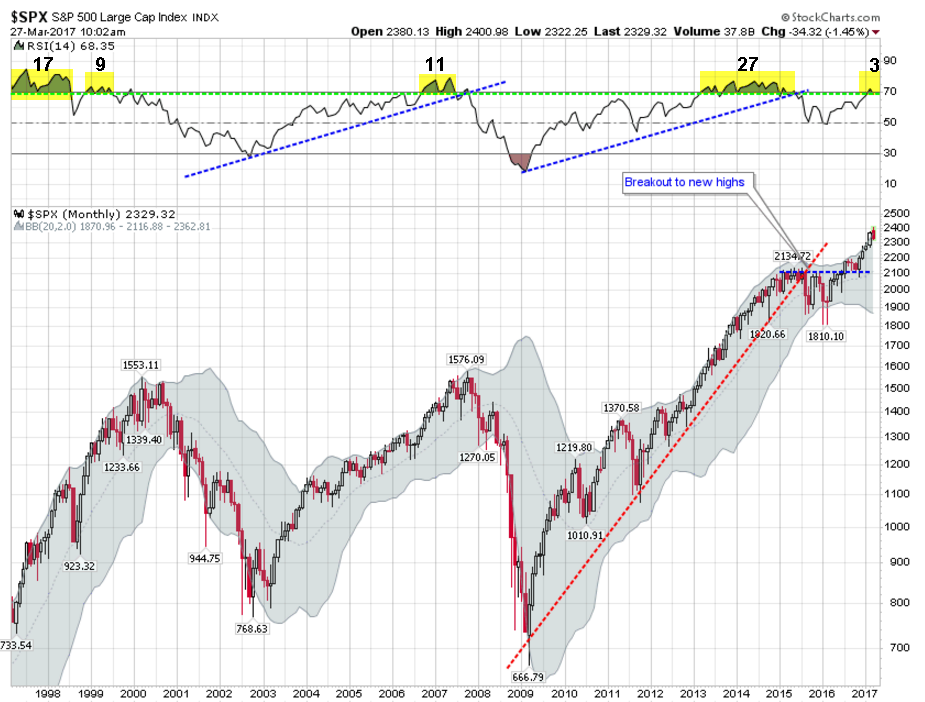
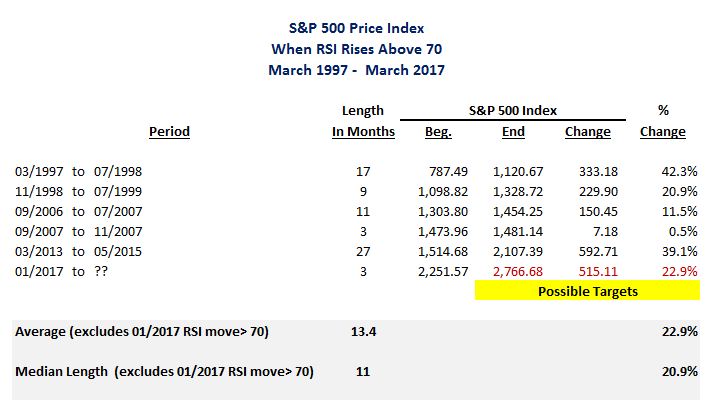
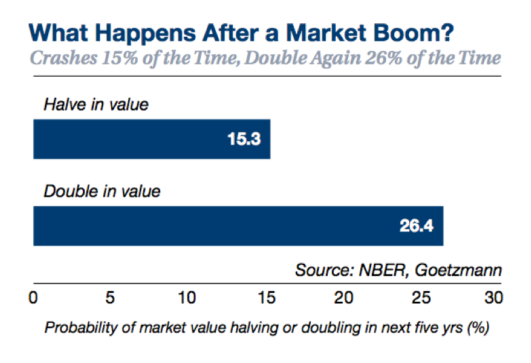
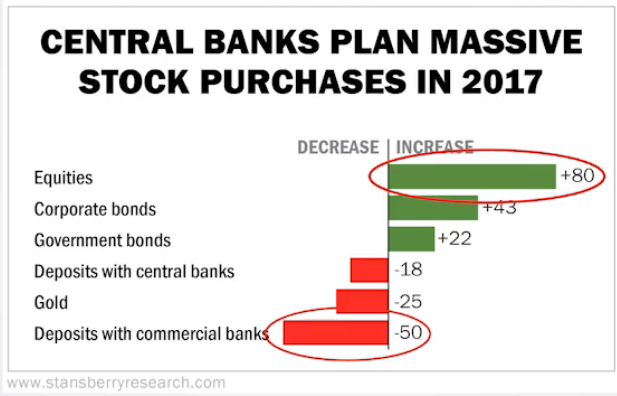
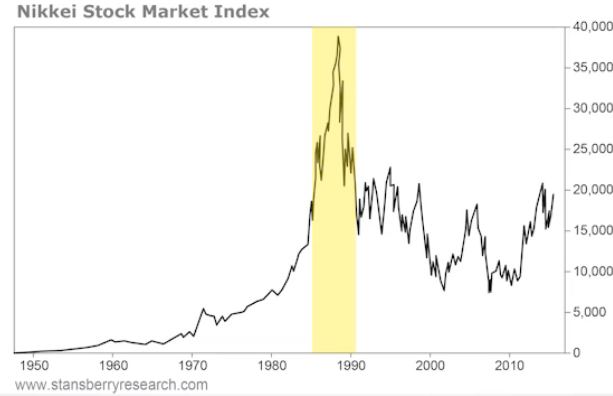
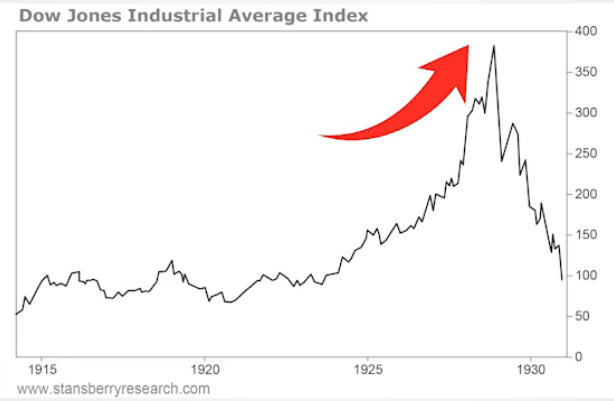
It was not my intention to write on the markets this month, but there have been so many poorly informed "negative naysayers" predicting a deep correction or a imminent 50% collapse in the markets, that I wanted to set the record straight. So for the record, we are due for a bit of a pullback and we have been doing a sideways to down pullback most of the month of March. So we are in the midst of that pullback now. It has just been mild so far. Some indexes, such as the small cap indexes, have been hit harder than others. Unless the wheels suddenly fall off the economy or some kind of unexpected shock comes from somewhere else around the globe, I expect markets to eventually move higher. Possibly much higher. So you must be saying to yourselves, how come you are now suddenly positive when you has been negative on the markets for much of the past few years? The answer is that the charts and data are telling us to be positive. For much of 2015 and 2016 we were in a big range and moving sideways. In July 2016, we finally broke higher out of this range (not lower as I expected) and so far we have not looked back. Here is what we are seeing: First, the charts are showing that long-term strength in the markets is still possible based on historical chart patterns (real historical precedent). If you look at the chart (above), you will see that the top RSI indicator is now above 70 on this monthly chart of the S&P 500 index. The RSI indicator, according to Wikipedia, is a technical indicator used in the analysis of financial markets. It is intended to chart the current and historical strength or weakness of a stock or market based on the closing prices of a recent trading period. In other words, it is a momentum indicator. However, you don't really need to know anything about this indicator to see that when it moves above 70 (as highlighted in yellow), it usually stays there for an average of 13.4 months, based on 1997 - 2016 historical data. Notice we crossed the 70 level in January of this year. So based on the average, you could expect this indicator to stay above 70 till January or February of 2018. So what happens when the RSI indicator is above 70? Usually the largest and most steep part of the stock market move occurs or as we call it the "melt up." This is the point that the most money is made in the market's move. So if we look at the past 5 times the market has risen above this level and stayed above 70 for more than 3 months, we find the following moves are possible: So historically the market has added 22.9% on average in return for the 13.4 months it stayed above 70 on the RSI. So based on this alone, I think the stock markets are headed higher, possibly much higher. History would say we could look for a price target in the range of 2766 for the S&P 500 come January/February 2018. Secondly, the bureau of labor statistics published a paper by Yale Professor William Goetzmann. In it, he showed that booms are rarely followed by busts. His study of 42 different stock markets from 1900 to 2014 found that booms are more likely to be followed by more booms. In fact, a stock market that’s doubled in the past year is almost twice as likely to double again as it is to get cut in half in the year that follows as you can see below. My third and final reason that markets have further to go is a simple physiological one and that is no one is bragging about how much they earned on their investment portfolios yet. No bull market ends without excess enthusiasm for stocks! In my experience, this is the most hated bull market that I have participated in to date. In fact, I have taken several calls over the past few weeks from clients where I have had to defend the markets in relation to the alternative bubble, real estate. Somehow, in our boom or bust real estate market in Tampa, my average client is more excited about real estate than the stock markets, even though we have had a nice market run since mid-2016. How this can be when list prices per square foot are already at 2007-2008 bubble levels (see Real Estate - Is The Party Over?) and interest rates are on the way up is mind boggling to me? Real estate is not only in a bubble, but it is also not liquid so it is not like you can press a button and get out of your ill-timed investment overnight! But I digress! So no bull market ends without like enthusiasm for stock markets and we do not have that yet. In fact, far from it! One last thought, Stansberry Research is suggesting that Central Banks around the world are dumping cash and funneling their cash into equities and bonds. This has already begun in Japan and Europe but they suggest that these actions could be followed by some 80% of Central Banks globally in 2017, including the U.S. Federal Reserve Bank (once their restriction against doing so is lifted by Congress). They (Stansberry Research) further suggest that market "melt ups" like the one experienced in the Nikkei Stock Market in the 1980s (below left) or the one experienced in our own Dow Jones Industrial Average in the 1920s (below right) are possible. Click here (http://lastbullmarket.com/bull_market_fb.html) to watch the entire Stansberry Research presentation.
Now obviously no one knows for sure what might happen, but I think there is a pretty good chance we will at least see an average move of 13.4 months and 22.9%. If it "melts up" all the better for our clients and investors. Let me also point out that following a typical "melt ups" there always a "melt down" and this could also be a time of great opportunity and we are very excited about it. So my advice is hang on tight because it looks like markets want to move higher and if the Central Banks around the world decide to increase their buying of securities due to global growth concerns, this thing could really take off! Let me know your thoughts. Please leave a comment below. Important Disclosures: Past performance is not an indication of future performance and there can be no assurance that the above indexes will achieve results in line with historical results. This blog post is for informational purposes only and is not intended as an offer or solicitation with respect to the purchase or sale of any security. The S&P 500 Index is a capitalization weighted index of the 500 leading companies from leading industries of the U.S. economy. It represents a broad cross-section of the U.S. equity market, including stocks traded on the NYSE, Amex and NASDAQ. The Dow Jones Industrial Average (DJIA) is a price-weighted average of 30 significant stocks traded on the New York Stock Exchange (NYSE) and the NASDAQ. The DJIA was invented by Charles Dow back in 1896. Nikkei is short for Japan's Nikkei 225 Stock Average, the leading and most-respected index of Japanese stocks. It is a price-weighted index comprised of Japan's top 225 blue-chip companies traded on the Tokyo Stock Exchange. The Nikkei is equivalent to the Dow Jones Industrial Average Index in the United States.
3 Comments
4/10/2017 01:02:25 pm
Not sure if this is a good or bad thing, but now even Morgan Stanley agrees we could see a significant rally.
Reply
5/2/2017 08:37:08 pm
Mark Hulbert agrees with me that this market could go much higher in his piece "This is what the bull market’s last gasp looks like." He also agrees obviously that this could be the last big push higher.
Reply
6/23/2017 02:10:29 pm
It seems I am carrying on a conversation with myself. So what else is new! However, I did find this World Out of Whack a perfect fit with the post above. Check it out at:
Reply
Your comment will be posted after it is approved.
Leave a Reply. |

