|
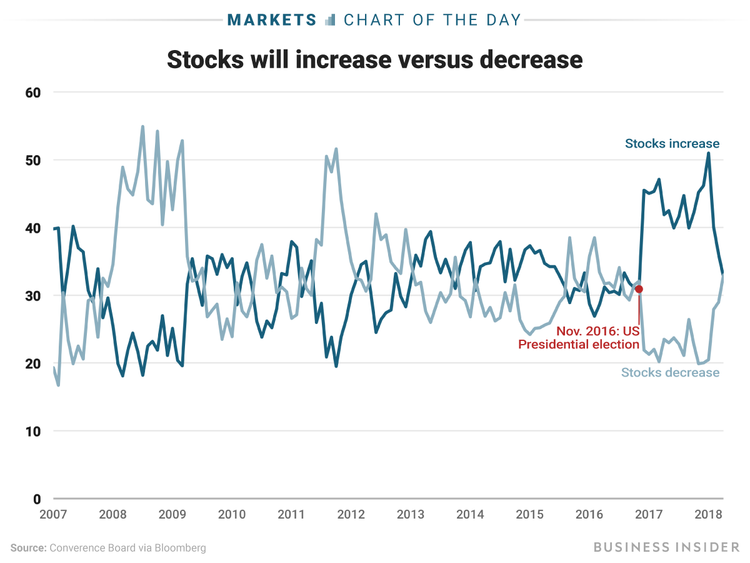
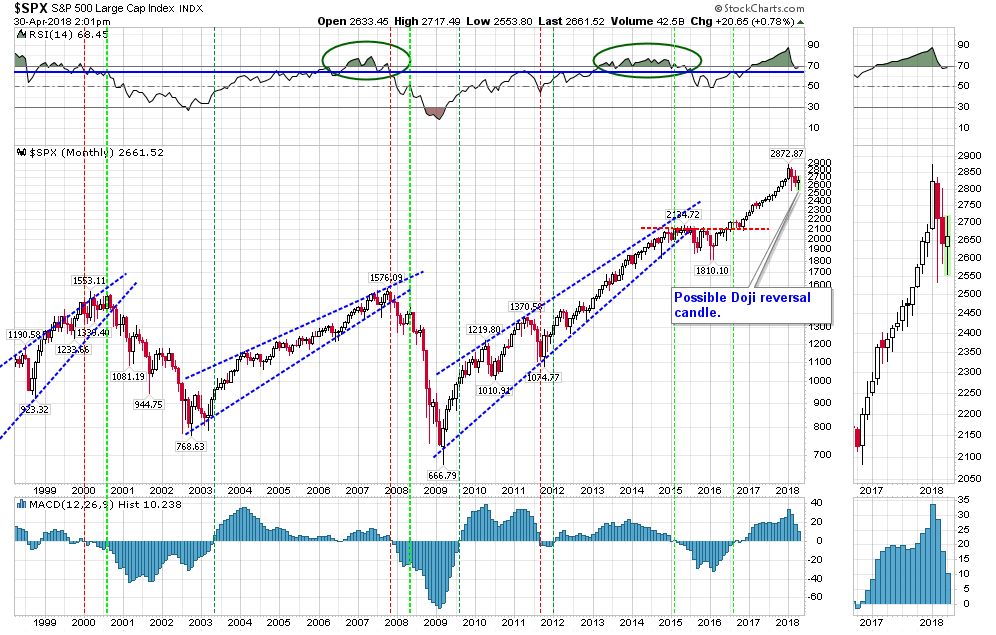
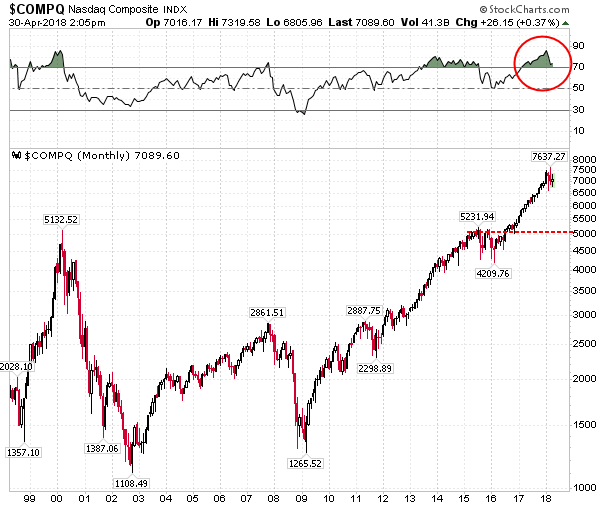
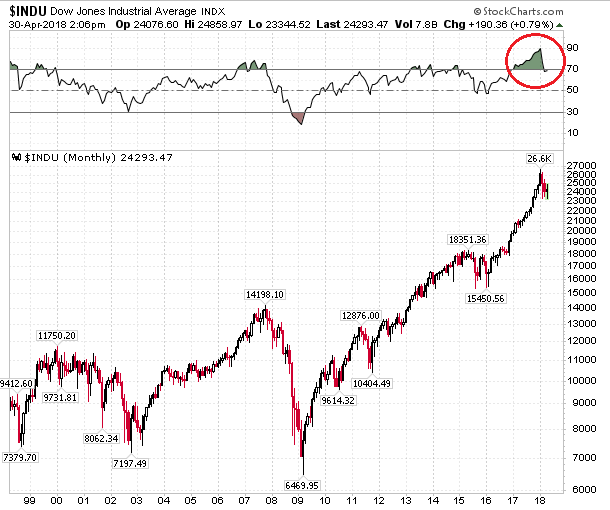
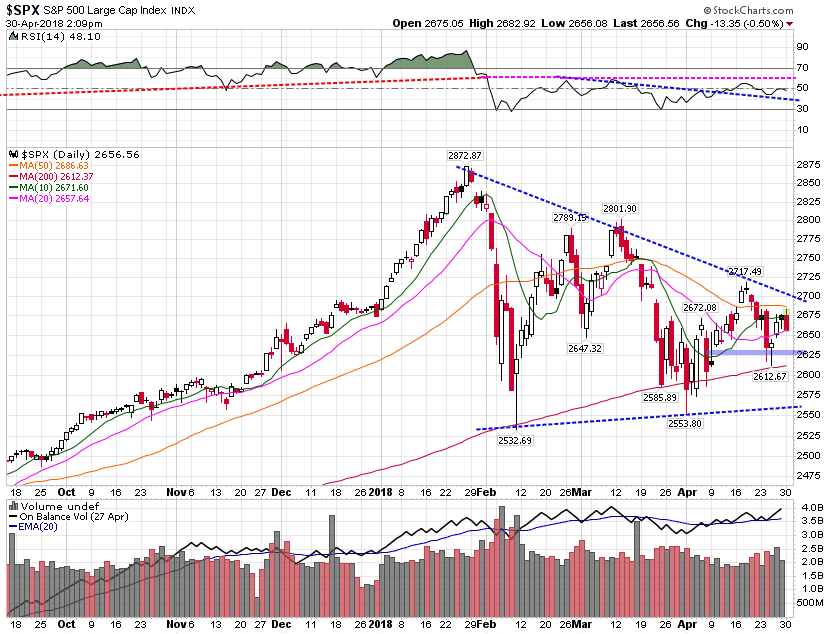
The recent NBA playoff series between the Indiana Pacers and the Cleveland Cavaliers may be been a metaphor for the current stock market played out in a different arena. The incumbent and reigning Eastern Conference champion Cleveland Cavaliers faced off against the rising, young and inexperienced Pacers in a series few expected to go seven games. The best of seven series was all tied at three games a piece as it entered a pivotal game seven at Cleveland’s Quicken Loans arena. Could Cleveland’s star player and certain Hall of Famer, Lebron James, do it again? Could he hoist the team on his shoulders and find a way to win against a more talented team from top to bottom? As has been the case for so many seasons, Lebron James saved his best for last! He scored 45 points on Sunday night on 16-of-25 shooting from the field. This was his third 40-point plus game of the series. He single handedly carried his team to a game seven win, 105-100 over the upstart Pacers. James finished the series with a 34.4 points per game average on 55.3% shooting from the field, both well above his season averages. Asked after the game to describe how he felt, he simply said “I am burnt right now……I’m tired and want to go home.” So what does this story have to do with the stock markets? Quite a lot actually! Lebron James averaged 34.4 points per game during this seven game series. This is a full 6.9 points per game over his season average of 27.5 points per game. You don’t think that game seven was the only game Lebron James went home tired do you? He carried his team in this series. No one on his team scored more than 20 points in any one game. Much like Lebron is tired following his game seven win. I believe the markets are tired as out outlined in our recent quarterly client letter. However much like Lebron James game seven heroics, I believe this market has "One More Run" left in the tank. Let me tell you why. First, more Americans expect stocks to fall over the next 12 months than rise, according to the Conference Board’s Consumer Confidence survey for April. This is the first time this has happened since the election. I know I personally have heard from more nervous clients in the past few weeks than at any time since the Great Recession. So let me tell you why this is a good thing. It simply because Bull Markets usually do not end with a fearful public, they end with mass euphoria and a public in denial. I know its contrarian, but it’s true. You can see in the chart below that consumer sentiment has sure shifted to the negative side. Second, the long-term trend is still up. Here is a chart of the S&P 500 index and there is obviously a lot here, but let me try to unpack this for you. The RSI indicator (top chart pane) is a momentum indicator. Notice how we are still above the blue support line for this indicator at around 68. It has also peeked below the 70 line in the past and recovered (see the 2013-2015 period). So it's possible that this is what is happening this time. Also the price chart (middle pane) has formed a doji candle. This is typically a reversal candle. In this case, the sign of a possible upward reversal. You can see it even more clearly on the far right of the chart in the zoom thumbnail. It looks like an old style transistor in a electronic device. If I throw in the charts of the Nasdaq Composite and the Dow Jones Industrial Average (below), you would see all charts are similar with the Nasdaq being the strongest with its RSI still greater than 70 (another positive sign). Finally, when we move from monthly charts (very long-term) to daily charts (shorter term),we see that the S&P 500 (and Dow Jones Industrial Average – not pictured) has formed a consolidation pattern (the blue dotted lines). This pattern called a symmetrical triangle usually is a continuation pattern of the previous market direction.
The trend prior to this consolidation pattern was up as you can see from the moving averages (orange, pink and green) on the left of the chart. It would stand to reason then that the odds favor an upside break above this consolidation pattern based on historical price patterns. We can also see in the lower pane that the volume moving averages are starting to trend upward, which I also believe is a positive trend. If we stay above the thick blue/purple trend line at 2625, I believe the markets will eventually break to the upside. Even if the markets move lower than 2625, I believe there is a good chance it will just retest the lower band of the symmetrical triangle and then bounce higher. So let’s say I am right, what does this say for the markets? I believe just like Lebron’s James heroic efforts to push his team to a game seven win, this market will do what it needs to break out again, just maybe, for one last move higher. Corrections are healthy and normal. We were overdue for a correction and I believe that is all this is at present. Bull markets don’t usually end with a shy public as we see in the confidence numbers, above. They usually end with a euphoric public taking every share available from an all too willing seller, Wall Street. You know the story from here. The public is left to hold the bag, while Wall Street counts its profits. It is a sad story! One that has been repeated throughout market history and one that I believe will repeat again before this market peaks. One last thought! Who is watching your investment assets? Does that person have the tools and training to make sure you are not part of the usual carnage brought upon the unsuspecting public by a sophisticated and experienced Wall Street. If not, maybe it’s time we talk? Schedule your free second opinion now.
0 Comments
Your comment will be posted after it is approved.
Leave a Reply. |


