|
Many of you have never heard of recency bias, but it all around us today. According to DaveManual.com, "Recency bias" is the phenomenon of a person most easily remembering something that has happened recently, compared to remembering something that may have occurred a while back. In every day life we all experience recency bias! Just think for a moment about the best movie you have ever seen. I bet the mental process is affected by a recency bias because quite frankly it is simpler to remember the Star Wars Sequel you just saw (Rogue One) over the original Star Wars you may have seen in 1978, like me. So how does recency bias affect investing and capital preservation? Simple, as investors we tend to chase what has been working best in a search for higher returns. When we do this we inevitably rush to the same side of the boat as other investors as I talked about in my post entitled "Is the Market for Passive Strategies Really Just Load Shifting?" because this is the popular trade. For many of us who, if not for bad luck, we would have no luck at all, we shift just at that moment in time that popular investment or trade is losing its advantage. What happens next is a reversion to the mean or average that then costs us money. Today, I am going to share with you a number of graphs that clearly show both a recency bias by market participants and the growing possibility of a reversion to the mean. Let's first start with a graph showing what investors are seeing today. 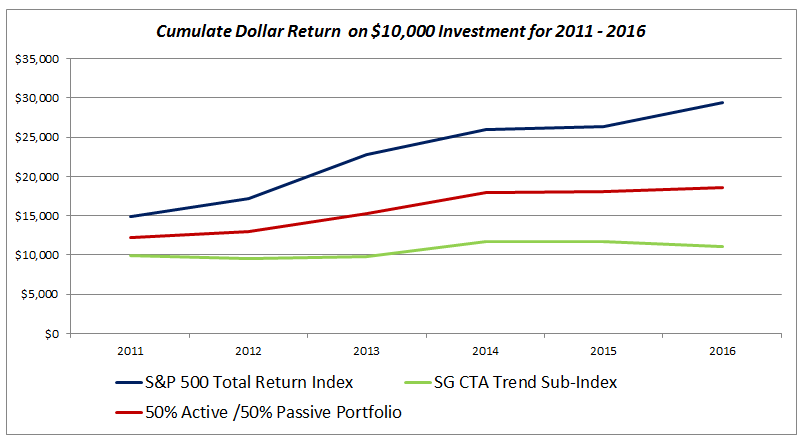 This is a graph of the S&P 500 Total Return Index versus both the SG CTA Trend Following Sub-Index (an active strategy index of commodity trading advisors) and a portfolio that is 50% active (the SG CTA Trend) and 50% passive (the S&P 500 Total Return Index on a cumulative return basis assuming a $10,000 initial investment for each. Clearly, the S&P 500 Total Return has been the place to be over the past six years! As a result investors are piling into index based investments pulling investment dollars from active managers, like the trend followers that make up the SG CTA Trend Sub-Index. However, let's now pull back a bit and get a greater perspective by looking at those same returns since 1990, below. 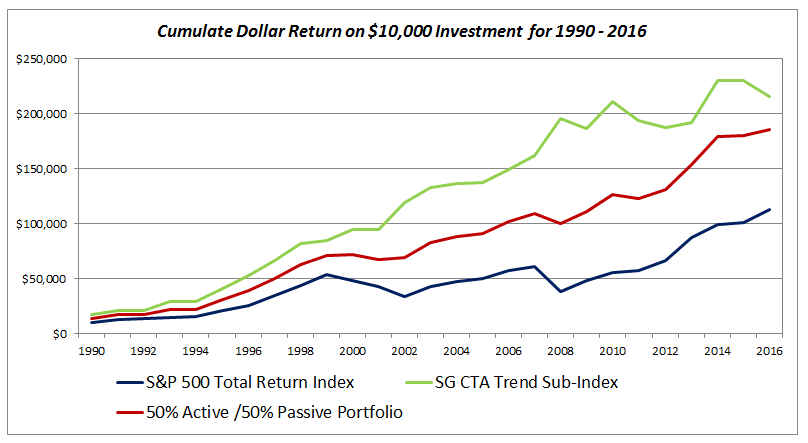 Now what do you see? Here clearly the active managers are the historical winners, except for the last 6 years or so. Also note how well the 50% active / 50% passive portfolio did during this period both in terms of return and the smoothness of the return stream (more on this later). So is it possible, assuming the world has not changed measurably, that investors have lost sight of what has worked historically to chase returns in the here and now? I mentioned reversion to the mean earlier. Which charts below are the the most susceptible to a reversion to the mean (the mean is represented by the red linear trend line)? 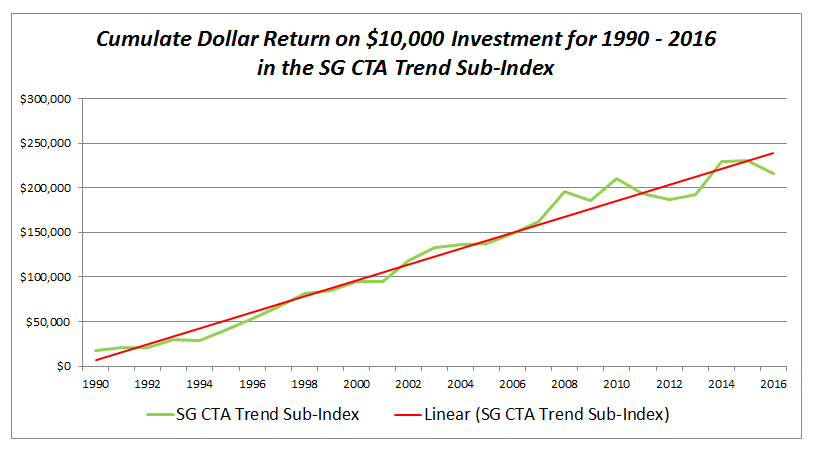 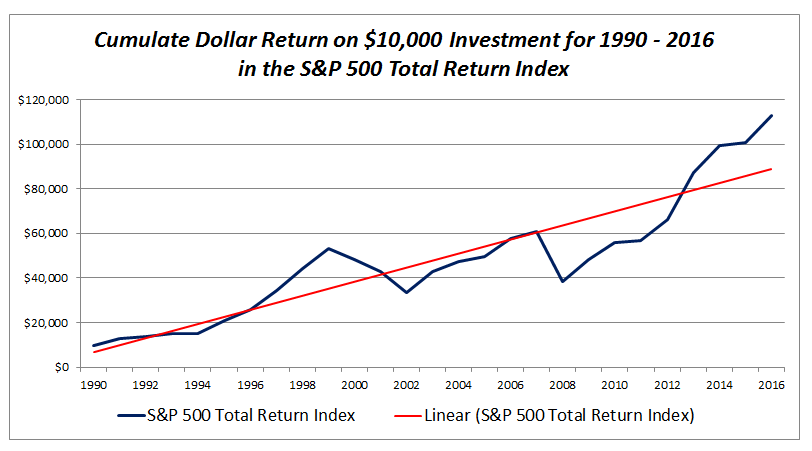 If you answered the S&P 500 Total Return Index, you are correct. Of the two charts, it appears the SG CTA Trend following index could be primed to rebound towards or even above its linear red line. The S&P 500 one would figure is most susceptible to a move towards or below the linear red line or mean. Obviously, I have no idea on the timing and the S&P 500 could continue higher, but it stands to reason it will eventually have to turn lower and towards its mean. So let's say the S&P 500 and markets in general do turn lower, how do you best position oneself for that eventuality? We believe the answer is to have both passive (index) and active managers, specifically trend following managers. Here is the why? 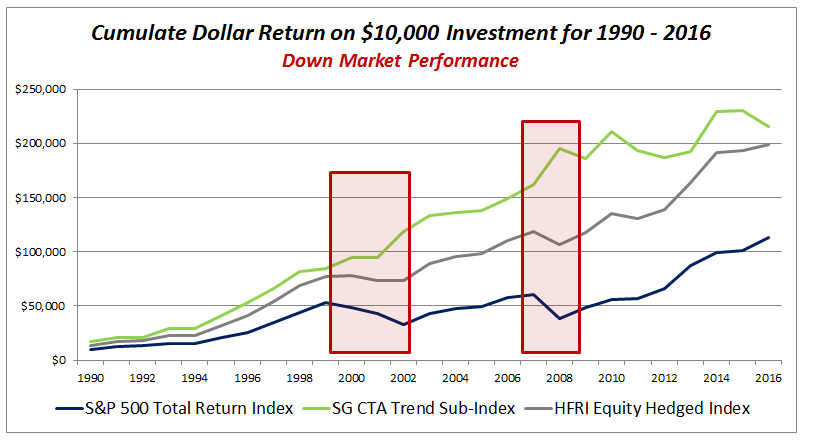 When that down market for the S&P 500 comes, trend followers generally do well (see boxes in red). Despite their reputation, the Equity Long/Short hedge funds (represented here by the HFRI Equity Hedged Index, still lose money but not as much as the pure, passive S&P 500 Total Return Index. The trend followers are the only ones that have an almost zero correlation (i.e. the degree to which two securities move in relation to each other) with the S&P 500 index and they bring down the overall portfolio beta (or volatility vs. the benchmark S&P 500 Index). You can see this below in the chart of beta. Notice how the beta of the 50% active / 50% passive portfolio is lower than holding just the S&P 500 Total Return Index or for that matter the HFRI Equity Hedge Index. 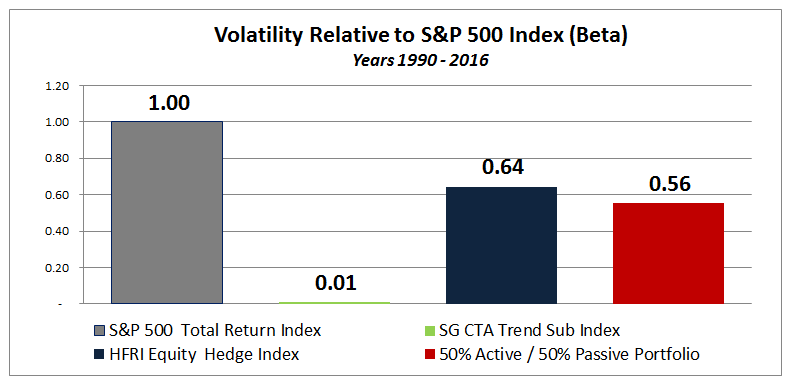 So the moral of this whole story is simple! Don't throw out the active managers from your portfolio just because they have under performed. In fact, it is probably time to allocate even more dollars in this direction as a contrarian play on the likely reversion to the mean that is sure to come. Remember this current bull market is already the 3rd longest advance on record. What are the odds it continues much longer? If we can help you with portfolio construction or one of our many unique active or passive investment strategies, please feel free to reach out to us. Important Disclosures: Past performance is not an indication of future performance and there can be no assurance that the above indexes will achieve results in line with historical results. This blog post is for informational purposes only and is not intended as an offer or solicitation with respect to the purchase or sale of any security. The S&P 500 Total Return is a capitalization weighted index of the 500 leading companies from leading industries of the U.S. economy. It represents a broad cross-section of the U.S. equity market, including stocks traded on the NYSE, Amex and Nasdaq. In this particular index dividends are reinvested and added to the index returns. The SG CTA Trend Sub-Index is designed to track the largest trend following CTAs and be representative of the trend followers in the managed futures space. The index is comprised of the 10 largest managers in terms of assets under management, equally weighted, rebalanced and reconstituted annually. These managers must be open to new investment and report daily returns. The HFRI Equity Hedge Index is an index of Investment Managers who maintain positions both long and short in primarily equity and equity derivative securities. A wide variety of investment processes can be employed to arrive at an investment decision, including both quantitative and fundamental techniques; strategies can be broadly diversified or narrowly focused on specific sectors and can range broadly in terms of levels of net exposure, leverage employed, holding period, concentrations of market capitalizations and valuation ranges of typical portfolios. EH managers would typically maintain at least 50% exposure to, and may in some cases be entirely invested in, equities, both long and short. A 50% active / 50% passive portfolio is just a simple portfolio that is 50% the historical returns of the SG CTA Trend Sub-Index and 50% the returns of the S&P 500 Total Return Index.
1 Comment
4/30/2017 10:21:18 am
Excerpt from Capitalist Exploits (www.capitalexplits.at) 4/26/2017 Your comment will be posted after it is approved.
Leave a Reply. |