|
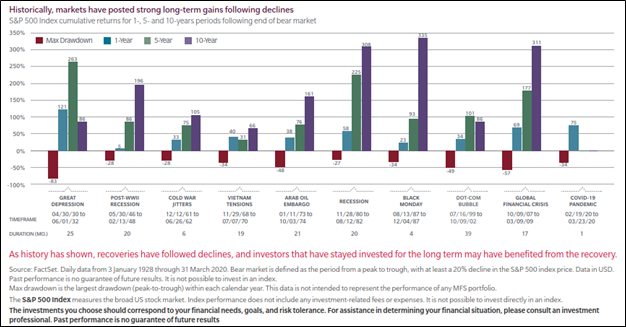
This has been quite the year for both equity and fixed income markets. Through June 30, 2022, the S&P 500 Index is down 21.25% and the Bloomberg Barclay’s U.S. Aggregate Bond Index is down -10.23%. There has been nowhere to hide, and portfolios have been tossed like a ship in a storm! June has been especially brutal with the S&P 500 Index sliding -8.38% over the past month through June 30, 2022. Obviously, none of this is great news. This is especially true for those individuals who simply “buy and hold” through the storm! If there is a silver lining, it is that Bear Markets do not last all that long. According to John Hancock funds, the average Bear Market only lasts about 289 days (9.5 months) on average. The bad news is they hit investors with an average decline of -35.62%. If this current decline is average in any way, we are more than halfway home in terms of days as of the date of this post and about two-thirds the way in terms of percentage decline. Of course, when is the last time anything in your life was just average? Given all the problems in the world with supply chains, run-away inflation, high consumer, and sovereign debt levels and more, it would not surprise me if this decline was anything but average. There are two pieces of good news however that I want to share with you today. First, if you are a client of In Trust Advisors, you are down far less than the market averages mentioned at the top of this post. Second, the biggest gains come after the storm. Since you are likely not here to hear me brag about our relative returns, lets focus on the second point, “The biggest gains come after the storm.” First, I would suggest you read our post from last month called The Bigger They Are, The Longer the Recovery. It will help put into perspective exactly why it is so important to minimize losses and the importance of doing so within the context of average annual stock market returns. In a nutshell, if the average decline for the markets is indeed -35.62%, that means on average it takes a 55.33% gain in the markets to get back to breakeven. The average market gain in a Bull Market is roughly 10% a year or so based on the average; you are looking at 5.5 years to regain the loss. The kicker is the average bull market is just 3.8 years in length since 1932. In a typical market cycle, you would have reached the end of the cycle before you recovered your market losses from the prior Bear Market based on the averages. Most Americans have a relatively short memory, and it is easy to get blinded by the 11-year Bull Market we had from 2009 to 2020, which was the longest in history. Most bull markets are significant shorter! Going forward, one would expect that the odds favor a return to the mean and shorter Bull markets! I don’t tell this to you to scare you, although it is sobering! What I wanted to point out that 10% per annum in a Bull Market is an average over Bull and Bear Markets. If we look at the chart below, you can see that the returns one year after a Bear Market are usually quite a bit larger than the average. We went back and averaged them and found that average to be 50%. Even if you throw out the highest and lowest return years, it is still +46% on average one year after the end of a Bear Market.
The moral of the story is historically, you can recover most of a bear market’s ravaged returns in the 12 months after a Bear Market, assuming the average historical loss and that you are fully invested or adding back exposure at the market bottom. This historically has not been something individual investors have excelled. They instead buy at tops and sell at bottoms or stay out of the markets entirely, thereby, missing the recovery rally. Another obvious fact is that if you can minimize Bear Market losses, you can be back in the green even faster. That is the crux of our entire strategy for investors. We are not able to walk on water, but we have historically lost a lot less in Bear Markets while capturing most of the upside during Bull Market periods, delivering smoother returns over a full cycle and, in theory, higher overall returns. If we can help you garner a smoother ride while potentially earning higher returns over full market cycles, please reach out to us. We offer a free portfolio review. Disclosures: Past performance is not indicative of future returns or performance. Neither is past history necessary indicative of what could happen this time around. Every Bear Market period is different. The S&P 500 index used here is the S&P 500 Price Index. The S&P 500 Price Index is a market-capitalization-weighted index of 500 leading publicly traded companies in the U.S. It is not an exact list of the top 500 U.S. companies by market cap because there are other criteria that the index includes. This is index does not include reinvested dividends. The Bloomberg Aggregate Bond Index or "the Agg" is a broad-based fixed-income index used by bond traders and the managers of mutual funds and exchange-traded funds (ETFs) as a benchmark to measure their relative performance. The index includes government Treasury securities, corporate bonds, mortgage-backed securities (MBS), asset-backed securities (ABS), and munis to simulate the universe of bonds in the market. It tracks bonds that are of investment-grade quality or better.
0 Comments
Your comment will be posted after it is approved.
Leave a Reply. |


