|
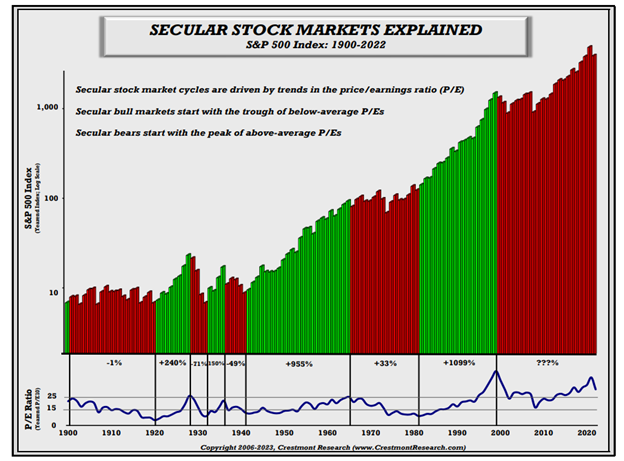
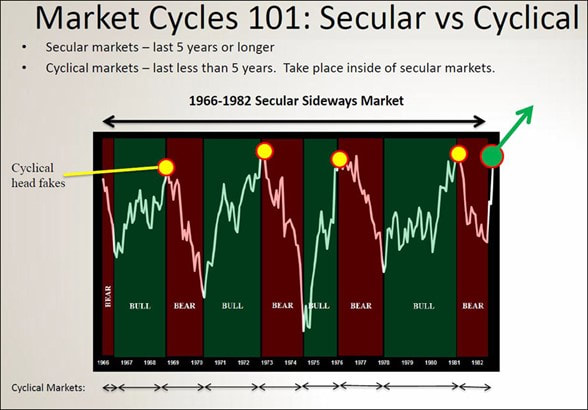
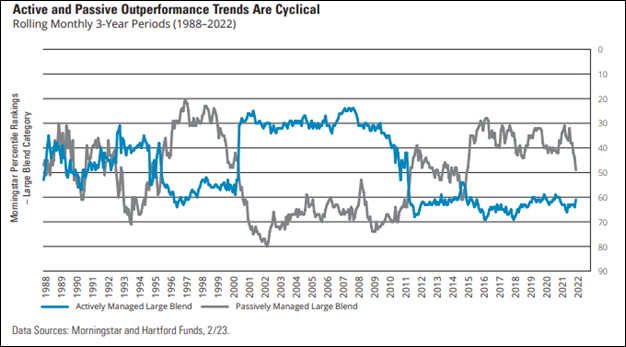
The famous saying goes “it is not what you make, but what you keep.” This is true of investment returns after the tax man takes his piece. It is also true about how much of the up market returns you keep as well as how much of the down market returns you avoid. This, of course, can be measured and most of the best investment managers do indeed provide such metrics. Here at InTrust Advisors, we track those metrics as well. The first is up capture or the amount of the upward move of the markets we capture vs. our blended benchmarks. The second is down capture or the amount of the downward move of the markets we capture. Ideally, the up capture is a high percentage with 100% being the top capture possible without the use of leverage. Also, ideally the down capture is low. As an example, a 60% down capture means that you only lost 60% of what the benchmark loses in periods where it declines on average. InTrust’s up capture is about 86% on average for our active investment strategies. Our down capture is about 56% in round numbers for the same active strategies.1 As you might expect, we spend a lot of time trying to figure out how to raise up capture or lower down capture statistics. We are quite proud of the down capture. We believe it allows our clients to sleep like babies, realizing we took almost half of the market’s volatility out of the equation (on average). Now this is all well and good, but let’s be honest when markets are juiced like they have been the past ten years and they just go straight up, who cares about up capture or down capture? The real secret to such metrics is when markets are volatile, like we had in the last secular bear market that lasted from 1966 to 1982. For those not in the know, a secular bear market is a long-term period where markets generally move up and down in a large consolidating range. The chart below shows the market to be in a long bear cycle (in red), currently. However, I don’t know if I agree with that assessment. I believe we may have had a secular bear market from 2000 to 2009, which was then followed by a secular bull market from 2010 to 2021. In my opinion, we are now at the start of another secular bear market, and I believe it will be a brute, like the one that spanned the 1970s. Just so we are clear, In the above diagram, the periods in red are secular bear markets and the periods in green are secular bull markets. It’s during these secular bear markets that maximizing up moves or capture and minimizing down moves or capture becomes important. Not to get carried away with cycles, but within each secular cycle are smaller cyclical bull and bear markets as shown below for the 1966 - 1982 period. You can link on the link to get more information on secular vs. cyclical cycles. The reason secular cycles are important is that differing investment strategies perform differently during such differing secular cycles. Passive or buy and hold performs best in secular bull cycles. Active strategies perform best in secular bear cycles. We mix active and passive strategies because we never really know what markets will do but we obviously can make educated guesses or assumptions and adjust allocations tactically for the perceived secular cycle (i.e., bull or bear). You can see this graphically below in the Active and Passive Outperformance Trends chart where you can see that Passively Managed Large Blend strategies have handily beat Actively Managed Large Blend strategies since 2011. However, you can also see there was the start of what appears to be a possible reversion to the mean in 2022. You can also see where Actively Managed Large Blend strategies decisively outperformed Passively Managed Large Blend strategies in the 2000 – 2010 period. It appears to us that we are transitioning to another period where active strategies may outperform passive strategies. When economic environments tend to get tougher, active strategies to do a better job of managing risk.
We will delve into why a lower down capture can help your portfolio in those periods where active strategies outperform in our next post. Disclosures/Footnotes 1 Excludes our modified buy and hold or passive strategies. This statistical is based on historical data from inception through July 2023 for each active strategy. The up-market capture ratio is the statistical measure of an investment manager's overall performance in up-markets. It is used to evaluate how well an investment manager performed relative to an index during periods when that index has risen. The up-market capture ratio can be compared with the down-market capture ratio. In practice, both measures are used in tandem. The down-market capture ratio is a statistical measure of an investment manager's overall performance in down-markets. It is used to evaluate how well an investment manager performed relative to an index during periods when that index has dropped. The ratio is calculated by dividing the manager's returns by the returns of the index during the down-market and multiplying that factor by 100.
0 Comments
Your comment will be posted after it is approved.
Leave a Reply. |


