|
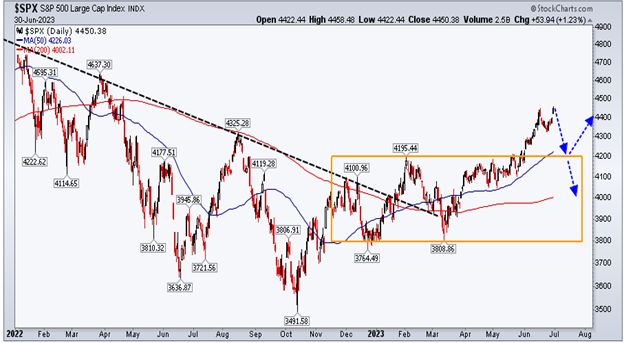
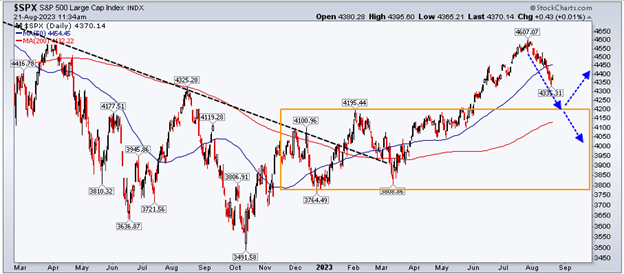
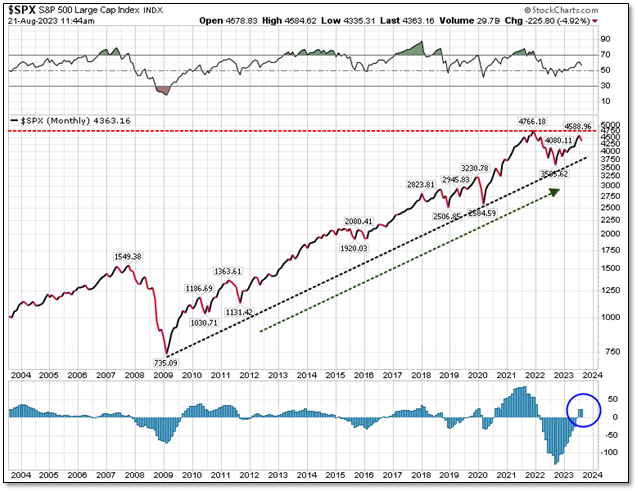
I put out a quarterly video to clients in early July outlining our thoughts on where the markets were headed. At that time, I outlined how I expected a market correction, and a retest of the June breakout levels (roughly 4200 for S&P 500 Index or the top of the orange consolidation box, below). I had no idea it would take us another month and 200+ S&P 500 points to finally see that correction begin. Here is where we are today. You can see we finally are in the midst of that correction we expected in early July. From a technical perspective, we are roughly one-half the way through the current correction. It would not unusual here to have a 3 - 4 day countertrend rally over the next week or so to pull back in the so called “dumb money.” It then appears leg two of the decline would begin assuming the market stays to script which it does about 80% of the time. The real question is what happens when the markets hit that breakout area of roughly 4200? There are really two major options: 1) it can bounce, or 2) it can break support and move back into the balance area below 4200. We expect the former, but one never knows for sure which is why we have also reduced market exposure in many portfolios. When we look out to a longer-term chart, we see a market that potentially wants to move higher based on the fact that we are still holding the long-term trend (black dotted line) and that the MACD Histogram (bottom box) is now above the zero line which traditionally corresponds with bull market moves. Where is this supposed recession and Bear Market that we have referenced frequently in the past, you ask?
That appears to be in the future (or maybe not at all as is current consensus). It sure looks like the equity markets want to retest the S&P 500 highs at 4766 (red dotted line) after we complete this correction to us. I cannot honestly explain why the markets want to move higher, but maybe it’s all the fiscal stimulus still in the system offsetting the effects of rising interest rates. I really don’t know, nor do I care as the equity markets are the ultimate guide and they appear to want to move higher (subject to change of course). On the off chance we break below 4200, we enter the balance or consolidation range again. Here it is likely the market will continue its prior movements up and down within the range (the orange box in the first two charts). We are obviously rooting for the former vs. the latter scenario! Let us know if we can help you navigate these tricky markets. Disclosures Past performance is not indicative of future performance. This post is for informational purposes only see your financial professional before implementing or following any of the thoughts in this article. The S&P 500 is a capitalization weighted index of the 500 leading companies from leading industries of the U.S. economy. It represents a broad cross-section of the U.S. equity market, including stocks traded on the NYSE, Amex and Nasdaq.
0 Comments
Your comment will be posted after it is approved.
Leave a Reply. |


