|
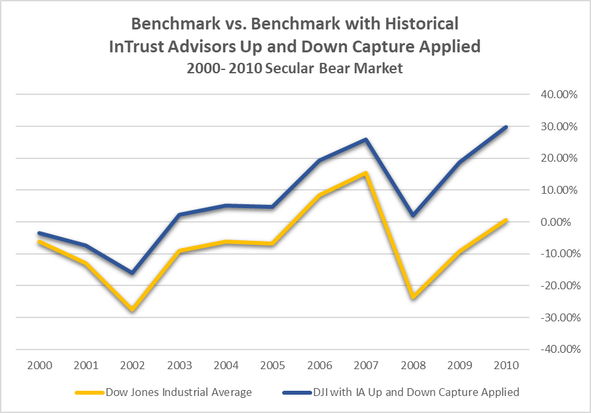
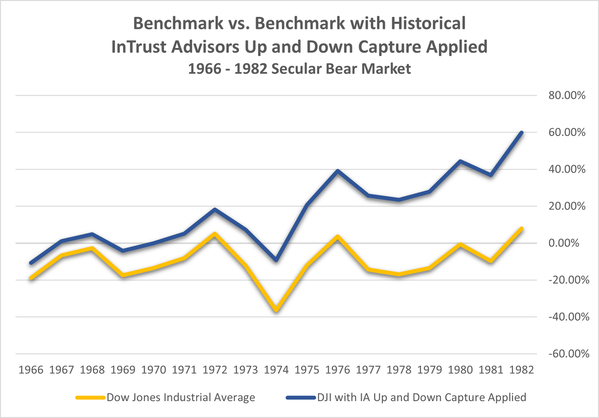
In our last post entitled "Why Understanding Up and Down Capture is Important to You?" we talked about both up and down capture and how they fit with secular periods of market consolidation. We also discussed that the ideal manager has both a lower down capture and a high up capture ratio. As an example, a 60% down capture means that you only lost 60% of what the benchmark loses in periods where it declines on average. Further, we noted that InTrust’s historical up capture is about 86% on average for our active investment strategies. Our down capture is about 56% in round numbers for the same active strategies.1 The real secret to such metrics is when markets are volatile, like we had in the last secular bear market that lasted from 1966 to 1982 or 2000 to 2009. In my opinion, we are now in a secular bear market, and I believe it will be a brute, like the one that spanned the 1970s. It will not be identical to the 1970s as no two periods are alike, but it will have a number of similarities. The reason secular bear market and cyclical cycles are important is that differing investment strategies perform differently during such cycles. Passive or buy and hold performs best in secular bull cycles. This is because they do not practice risk management other than via diversification, they are low cost and do not make significate changes to the portfolio holdings or exposures. In other words, they are very lean and efficient. Active strategies perform best in secular bear cycles. This is because they do practice risk management including diversification but also changes to exposure, positions and more. What is a drag on performance in the secular bull period helps enhance and protect returns in a secular bear market. We mix active and passive strategies because we never really know what markets will do but we obviously can make educated guesses or assumptions. Let’s take a look at an example of what happens to return in a secular bear market cycle when proper risk management is applied, and market exposure is adjusted for the market environment. In other words, the manager captures only a reasonable percentage of up market returns and/or a low-down market capture ratio. In this case, I applied our average up and down capture to benchmark returns for the period 2000 - 2010 where Actively Managed Large Blend strategies outperformed. This is not a perfect comparison, but a majority of our active strategies use this index (i.e., the Dow Jones Industrial Average) as at least part of the blended benchmark index. So, what did we discover? The average performance increase was 2.7% per annum over just buying and holding the index over this period. Again, we may have captured less up market performance, but we avoided more of the down-market under-performance and in this period, there was a great deal of market volatility. Let’s go back a bit further, let’s say we have a repeat of the 1966 – 1982 secular bear market that included the volatile 1970s. What does that look like? Even during this volatile period, applying InTrust’s historical up and down capture rations resulted in an average 3.1% per annum performance pick up for this period over just buying and holding the index.
Now these are all proforma or hypothetical results, but I do believe we can draw a few conclusions. First, there are definitely periods for markets where just buying and holding (i.e., passive management) will underperform. See Hartford’s chart of Active and Passive Outperformance Trends in the post, Understanding Up and Down Capture of Returns. Second, from a probability perspective, we are likely due for one of those periods based on Hartford’s chart of Active and Passive Outperformance Trends. Finally, you need to be prepared for such periods. Most American’s suffer from recency bias and overweight what has been working to the detriment of what has not been working as well. This bias can really hurt investors when Mr. Market flips the switch and decides to benefit the active managers by making markets more challenging for everyone. My guess, my friends, is that we started such a period at the beginning of 2022. Let us know how we can help you be ready for Mr. Market flip of the switch. Disclosures/Footnotes 1 Excludes our modified buy and hold or passive strategies. This statistical is based on historical data from inception through July 2023 for each active strategy. The Dow Jones Industrial Average is a price-weighted average of 30 significant stocks traded on the New York Stock Exchange and the Nasdaq. The DJI was invented by Charles Dow back in 1896. The up-market capture ratio is the statistical measure of an investment manager's overall performance in up-markets. It is used to evaluate how well an investment manager performed relative to an index during periods when that index has risen. The up-market capture ratio can be compared with the down-market capture ratio. In practice, both measures are used in tandem. The down-market capture ratio is a statistical measure of an investment manager's overall performance in down-markets. It is used to evaluate how well an investment manager performed relative to an index during periods when that index has dropped. The ratio is calculated by dividing the manager's returns by the returns of the index during the down-market and multiplying that factor by 100.
0 Comments
Your comment will be posted after it is approved.
Leave a Reply. |


