|
This is a very complex Macro environment due to Federal Reserve interventions, Government stimulus programs and fuzzy economic numbers that reflect the will of the party in power in Washington. Quite frankly, the last ten months for me have been very challenging. It was only recently that I stood back and tried to take a much longer, big picture view of the Macro landscape here in the U.S. that I think will frame how we tactically manage money for the next decade or more here at InTrust Advisors. What is that framework? Here it is: No. 1. The U.S. Government cannot repay its debt and lacks the will to do so. No. 2. The elected leaders in Washington will continue to print money, grow the size of the national government, and raise the U.S. debt levels because the alternatives (balanced budgets, debt repayment, downsized government, etc.) are just not something they want to stain their term in office and ability to seek reelection!  No. 3. Due to weak wills and misplaced objectives, the U.S. will have no choice but to inflate away its debts. It will not risk default, nor will it move away from the path of bigger government and more for all. No. 4. Traditionally foreigners have been big U.S. Treasury buyers. No longer, they are headed down the same path or they are seeking to separate themselves from the dollarized world and they will not be big treasury buyers going forward as you can see in the chart below. 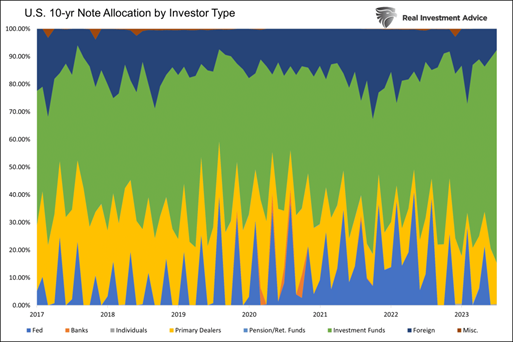 No. 5. The U.S. Government cannot allow interest rates to continue upward. The interest carry will continue to compound and become just too big a part of the U.S. budget. No. 6. The Federal Reserve will be the only big buyer of treasuries and that means currency debasement to do so (i.e., a falling dollar). This debasement may be hidden by a race for the bottom with other countries and currencies, but I think this is a race we will win! No. 7. The U.S. will use financial repression to debase its currency in a controlled fashion. However, it could spiral out of control and lead to runaway inflation. Financial repression is a term that describes measures by which governments channel funds from the private sector to themselves as a form of debt reduction. Financial repression here could be paying a return on treasuries that is less than zero after adjusting for inflation whereby they slowly rob citizens of purchasing power to lower debt levels in nominal terms. No. 8. U.S. residents could become U.S. treasury buyers in retirement plans or pensions. This will be sold to us as a way of protecting retirement savings but really would be about finding a home for this ever-increasing pile of debt. Japan’s citizens do this willingly. It’s likely here in the U.S. this will be legislated upon us. No. 9. Treasuries will no longer be a store of long-term value. They will need to be more actively managed and over time will lose some of their luster as rates are held down while inflation rises (i.e., financial repression). Also 40 years of falling interest rates has led to a fixed income being a larger part of every portfolio, rising rates over the next few decades will do just the opposite. 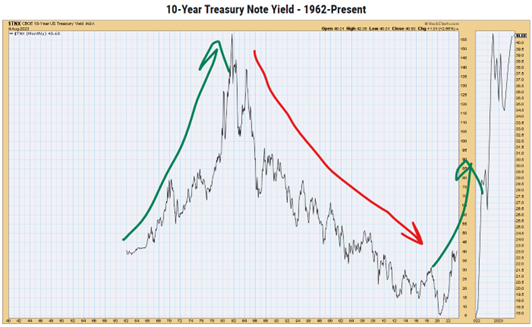 No. 10. Gold, commodities, and hard assets will once again become important holdings for Americans. The diversification of holdings into more than just stocks and bonds will become increasingly important. In summary, we are on the verge of a shift in our country’s financial outlook like we have not experienced in many years. The last such period was probably the late 1960s and 1970s. This may seem like gloom and doom but for every challenge there are opportunities as well! Let us know if we can help you unlock those opportunities. Disclaimer: This material has been prepared for informational purposes only, and is not intended to provide, and should not be relied on for, tax, legal or accounting advice. You should consult your own tax, legal and accounting advisers before engaging in any transaction.
0 Comments
Wealth is a relative concept, and different people may have different opinions on what it means to be wealthy. However, one way to measure wealth is by looking at the net worth of individuals or households, which is the difference between their assets and liabilities. According to the 2023 Modern Wealth Survey by Charles Schwab, the average net worth that Americans say is needed to be considered wealthy in the U.S. is $2.2 million. This is up from $1.9 million in 2020 and varies by region and city. For example, in San Francisco, the most expensive city in the survey, respondents said they needed $4.7 million in net worth to be wealthy, while in Houston, the least expensive city, they said they needed just $2.1 million. 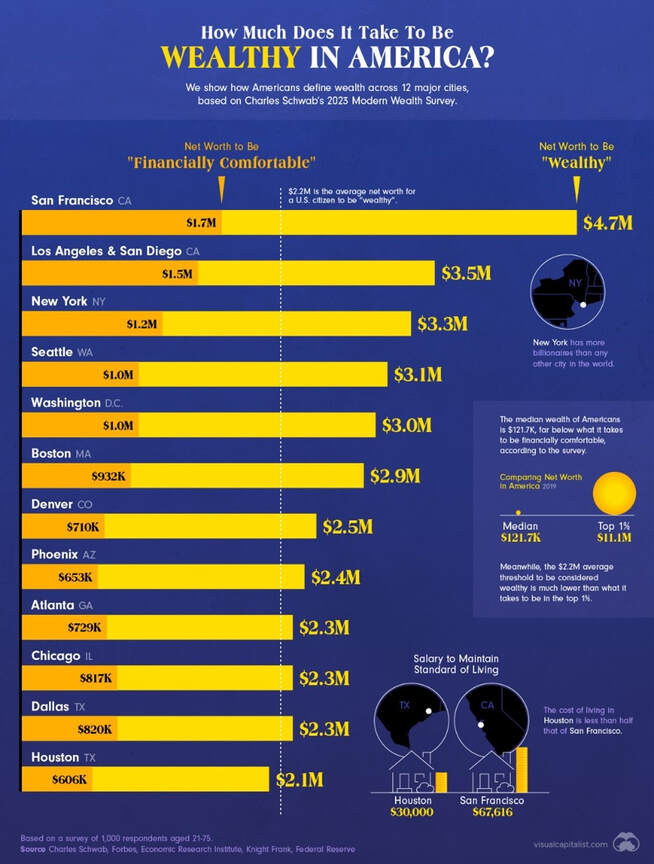 What about Tampa, Florida, where many of our clients live? How does it compare to other cities and the national average? According to CNBC, Tampa residents said they needed $2.4 million in net worth to be wealthy, which is slightly higher than the national average and lower than most other major cities. Tampa is one of the fastest-growing cities in the U.S., with a population of about 400,000 and a median household income of $59,893, according to the U.S. Census Bureau. The cost of living in Tampa is lower than the national average, but higher than some other cities in Florida. The median value of owner-occupied housing units in Tampa is $277,700, which is higher than the state average of $248,700. Tampa residents also have different perceptions of wealth than other Americans. For instance, 52% of Tampa respondents said they feel wealthy, compared to 48% of all respondents. Moreover, 60% of Tampa respondents said they live paycheck to paycheck, compared to 53% of all respondents. Additionally, Tampa residents have different priorities and goals when it comes to their finances. For example, 40% of Tampa respondents said their top financial goal is saving for retirement, compared to 35% of all respondents. Furthermore, 38% of Tampa respondents said they would use an unexpected windfall to pay off debt, compared to 29% of all respondents. Wealth is obviously a subjective term that depends on various factors such as location, income, expenses, assets, liabilities, and personal preferences. The real question is do you have this kind of wealth? The answer unfortunately is few have this kind of wealth. The better question for many may be “do you have a good financial plan and a willingness to embrace the facts and options available to you?” Yes, it would be simple if we were all “wealthy,” but the fact is that more than 90% of the population will never meet the definition of wealthy. So, what are you going to do to meet your specific goals and objectives without the ability to spend like a politician (i.e., the wealthy). We can help with that plan! Click here to get started. I put out a quarterly video to clients in early July outlining our thoughts on where the markets were headed. At that time, I outlined how I expected a market correction, and a retest of the June breakout levels (roughly 4200 for S&P 500 Index or the top of the orange consolidation box, below). 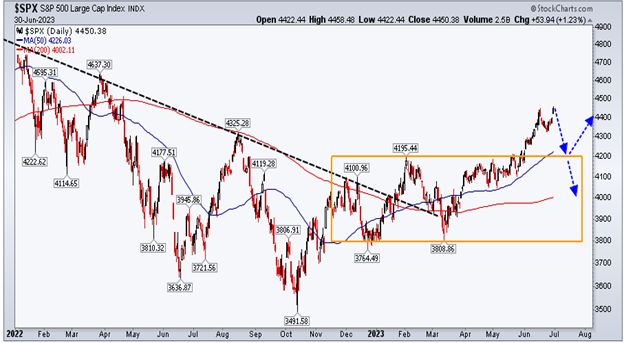 I had no idea it would take us another month and 200+ S&P 500 points to finally see that correction begin. Here is where we are today. You can see we finally are in the midst of that correction we expected in early July. 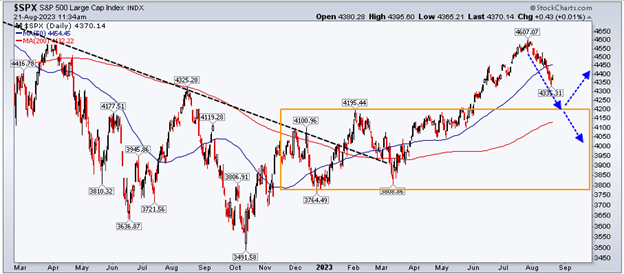 From a technical perspective, we are roughly one-half the way through the current correction. It would not unusual here to have a 3 - 4 day countertrend rally over the next week or so to pull back in the so called “dumb money.” It then appears leg two of the decline would begin assuming the market stays to script which it does about 80% of the time. The real question is what happens when the markets hit that breakout area of roughly 4200? There are really two major options: 1) it can bounce, or 2) it can break support and move back into the balance area below 4200. We expect the former, but one never knows for sure which is why we have also reduced market exposure in many portfolios. When we look out to a longer-term chart, we see a market that potentially wants to move higher based on the fact that we are still holding the long-term trend (black dotted line) and that the MACD Histogram (bottom box) is now above the zero line which traditionally corresponds with bull market moves. 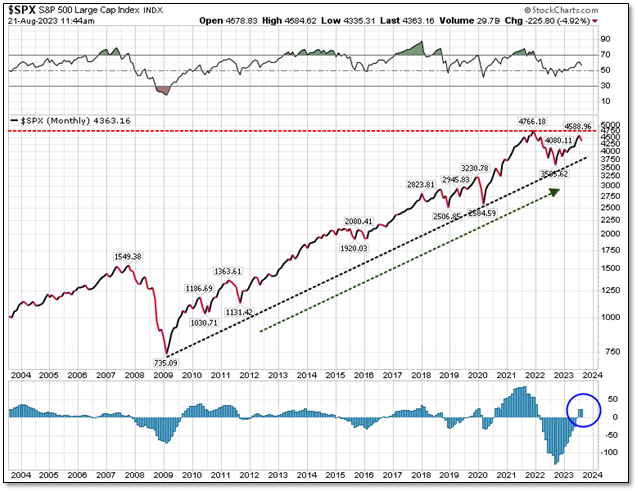 Where is this supposed recession and Bear Market that we have referenced frequently in the past, you ask?
That appears to be in the future (or maybe not at all as is current consensus). It sure looks like the equity markets want to retest the S&P 500 highs at 4766 (red dotted line) after we complete this correction to us. I cannot honestly explain why the markets want to move higher, but maybe it’s all the fiscal stimulus still in the system offsetting the effects of rising interest rates. I really don’t know, nor do I care as the equity markets are the ultimate guide and they appear to want to move higher (subject to change of course). On the off chance we break below 4200, we enter the balance or consolidation range again. Here it is likely the market will continue its prior movements up and down within the range (the orange box in the first two charts). We are obviously rooting for the former vs. the latter scenario! Let us know if we can help you navigate these tricky markets. Disclosures Past performance is not indicative of future performance. This post is for informational purposes only see your financial professional before implementing or following any of the thoughts in this article. The S&P 500 is a capitalization weighted index of the 500 leading companies from leading industries of the U.S. economy. It represents a broad cross-section of the U.S. equity market, including stocks traded on the NYSE, Amex and Nasdaq. Are you old enough to remember a song by Stealers Wheels called Stuck in the Middle with You from 1972. Click on the link to see if you remember this hit from the 1970s. The You in this case is Mr. Market or to be more relevant to our culture today, them/they Market. The Stuck is the S&P 500 Index and we have been stuck in a range (“the middle”) since the end of 2022 (green box, below). Right now, we are at the top of the range. We believe we are moving towards the middle or lower end of the range over the next few months 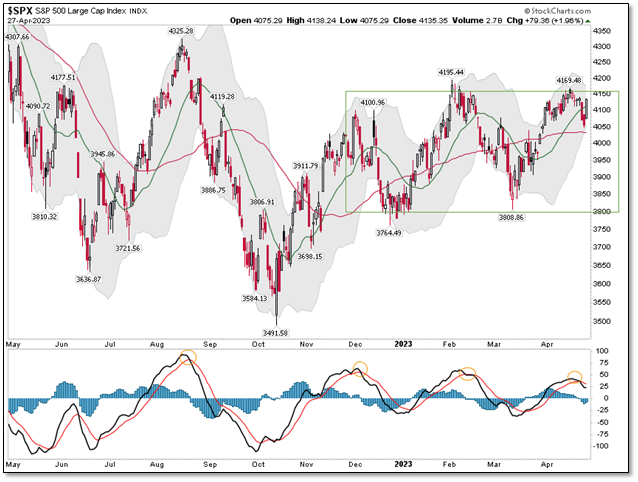 Why do we believe we will move to the middle or lower end of this range? Simply, the MACD moving averages are crossing over to the downside (see orange circles in lower chart pane). When this happens, it has historically led to a market decline or pullback. If I bring back that same chart, remove the green box and add a large consolidation triangle (blue dotted lines), you will see that something needs to break in the short-term. We either move higher and break above the dotted black line and the February highs or we head to the lower end of the triangle or potentially the lower end of the green box from the first chart. 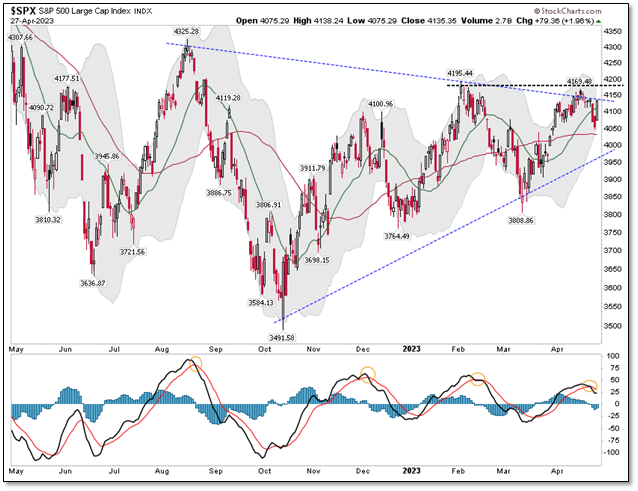 Once again, the lower chart window indicator is telling us the odds favor moving lower as the markets are very overbought. Seasonally, we are also entering the “Sell in May and Go Away” months of summer where positive returns have historically been harder to achieve. Thus, the seasonality seems to line up with what we are seeing in the charts. Let us now try to add a bit of bullishness to this discussion. In our client’s Q1 letter, we discussed the spread between 2-year and 10-year US Treasury yields and the fact it had declined below zero (called a Yield Curve Inversion). This inversion is a very dependable signal that a recession is coming in the next twelve to twenty-four months. Historically, after the inversion troughs and starts to reverse, we generally see positive market returns. Why is this? We are not in recession yet and 2-year rates begin to drift lower which allows short-term borrowers to lower their interest costs and thus this spurs some economic growth in the short term. As you can see (below), the 2-year/10-year US Treasury yields are currently inverted (below the gray zero line) but have recently started to reverse upward (not yet visible on the chart below). 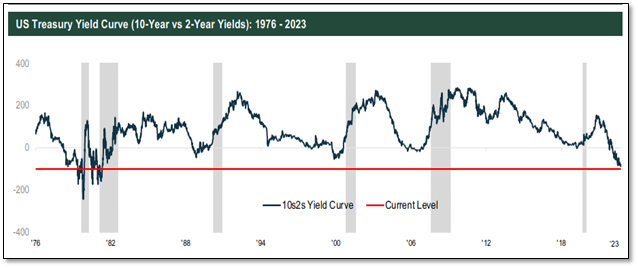 Historically, if you measure from this possible trough (i.e., reversal point) in past market cycles, we have realized a period of positive market returns of 10% - 11% over the ensuing six-to-twelve-month periods, on average (or a median return of 13% - 17% over the same period). 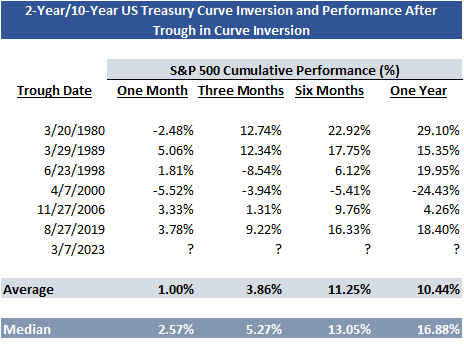 So how does this fit into our current situation?
First, we are at a potential 10s2s yield curve trough and you can see historically that has meant positive returns over the ensuing 12 months. Second, I believe we will unfortunately remain range bound in the green box from chart one. However, there is a good chance we revisit the lower end of that green range box and then finish the year at the upper end of that box again. Thus, if we can minimize the effects of the decline and capture most of the increase, we see a chance to finish 2023 on a winning note. Finally, we believe the pace of Federal Reserve interest rate increases is slowing and such increases are nearing a pause. This has historically been a strong time for fixed income/bonds where we can lock in higher interest rates and potentially benefit from rising fixed income prices when the Federal Reserve lowers its Fed Fund rate to fight the coming recessionary weakness in late 2023. As you can see this is a trader’s market right now! The most challenging Macro environment that we have experienced in 26 years of doing this. If we can help you navigate it, please feel free to reach out to us. Disclosures: Past performance is not an indication of future performance and there can be no assurance that the strategy will achieve results in line with those presented in this performance summary. No representation, warranty, or undertaking, express or implied, is given as to the accuracy or completeness of the information contained in this material by any person; no reliance may be placed for any purpose on such information; and no liability is accepted by any person for the accuracy and completeness of any such information. The S&P 500 is a capitalization weighted index of the 500 leading companies from leading industries of the U.S. economy. It represents a broad cross section of the U.S. equity market, including stocks traded on the NYSE, Amex, and NASDAQ. On December 29, 2022, the second of the SECURE Acts (or the SECURE Act 2.0) was signed into law. Just like a good movie, there is nothing like a sequel!
SECURE stands for Setting Every Community Up for Retirement Enhancement. Just like every other enhancement bill from our good friends in Washington, it would be wise to see that you still have your wallet after its passage. Both Secure Acts seek to reform how Americans prepare for retirement while juggling current spending needs (i.e., sticking it to some taxpayers). Since few Americans are financially prepared for retirement, this bill has a lot of heavy lifting to do. Usually, these bill have such reassuring names but do very little to make your life better (my opinion only). At first blush you will likely see the added burden both administratively and cost wise that Congress has forced on companies to give you the flexibility reflected below. Let’s take a look at some of the key provisions that affect our average clients. For Individual Savers:
For Employer Plans: There also are provisions to help employers offer effective retirement plan programs:
Other Savings and Withdrawal Provisions: It can be hard to save for your future retirement when current expenses loom large. We advise proceeding with caution before using retirement savings for any other purposes, but SECURE 2.0 does include several new provisions to help families strike a balance.
All Things Roth: Tax planning for your retirement savings is also important. To help with that, you can typically choose between two account types as you save for retirement: Traditional IRA or employer-sponsored plans, or Roth versions of the same. Either way, your retirement savings grow tax-free while they're in your accounts. The main difference is whether you pay income taxes at the beginning or end of the process. For Roth accounts, you typically pay taxes up front, funding the account with after-tax dollars. Traditional retirement accounts are typically funded with pre-tax dollars, and you pay taxes on withdrawals. That's the intent, anyway. To fill in a few missing links, the SECURE 2.0 Act:
There's one thing that's not changed, although there's been talk that it might: There are still no restrictions on "backdoor Roth conversions" and similar strategies some families have been using to boost their tax-efficient retirement resources. New RMD Provisions: Not surprisingly, the government would prefer you eventually start spending your tax-sheltered retirement savings, or at least pay taxes on the income. That's why there are rules regarding when you must start taking Required Minimum Distributions (RMDs) out of your retirement accounts. That said, both SECURE Acts have relaxed and refined some of those RMD rules.
Next Steps: How else can we help you incorporate SECURE 2.0 Act updates into your personal financial plans? |